Dahlen Silva is a Ph.D. Candidate in Transportation Engineering at Budapest University of Technology and Economics.
“My research establishes a solid methodological foundation through an extensive literature review and the use of existent methods. I have pioneered the development of four methods to be used by urban planners and business managers to reveal the impacts on urban space and business.”
Method for Urban Space Allocation – Attributes
The main elements are listed in Table 1 to Table 4, and are used in the equations of the proposed urban space allocation method.
Table 1 – Attributes of travelers.
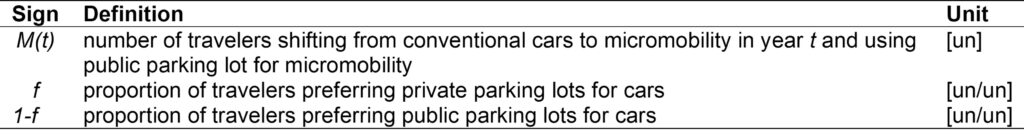
Table 2 – Attributes of fleet according to vehicle usage.
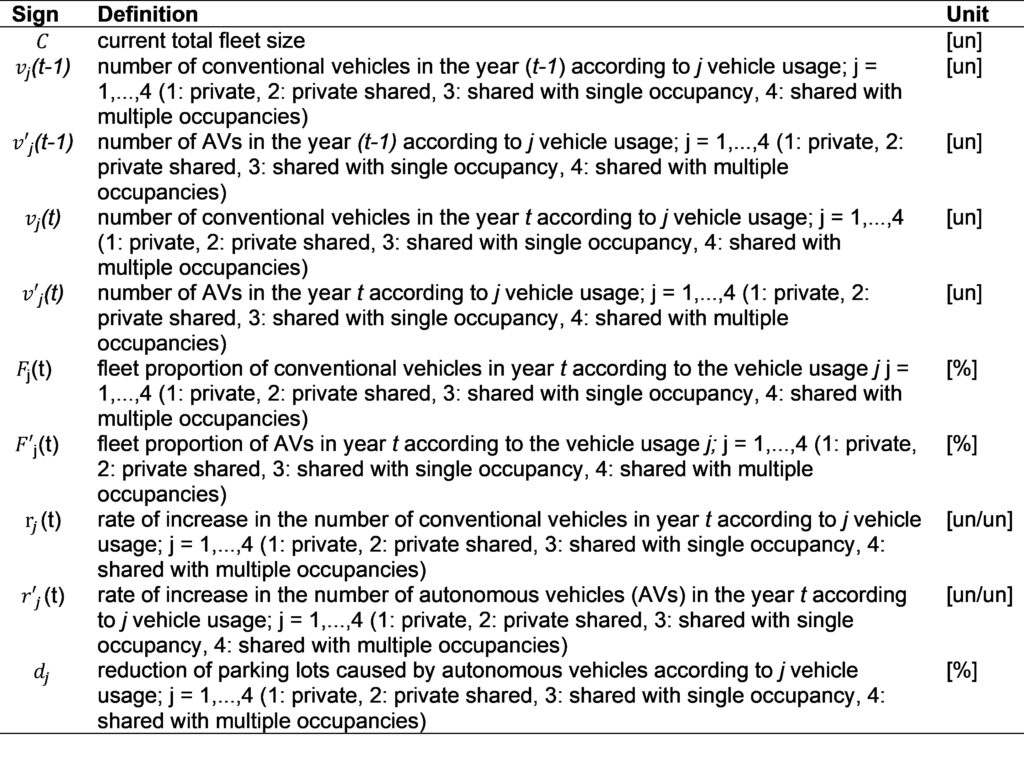
Table 3 – Attributes of public space area.

Table 4 – Attributes of public parking lots.
Method for Urban Space Allocation – Steps of the Method
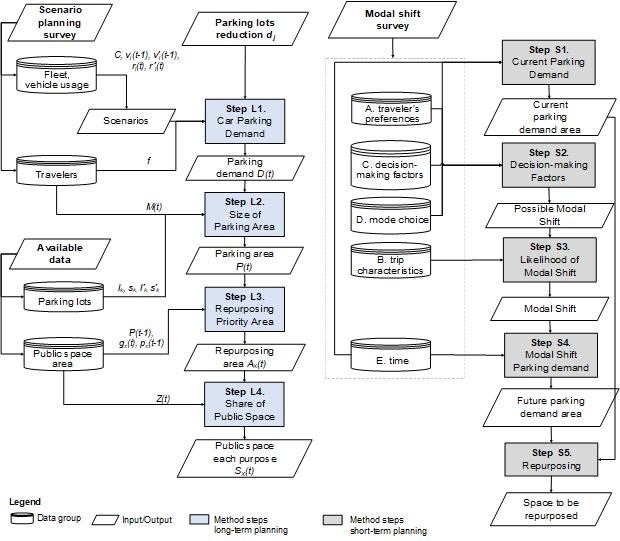
Long-term planning
Urban planners collect the data about the parameters revealed in the data model (Table 1 to Table 4 in previous section Attributes). The collected data are inputs during the application of the urban space allocation method.
They identify the data available for conventional vehicle fleet size C, current conventional vehicle usage j and parking preference f, in:
- Municipalities’ annual reports.
- Reports of consulting companies.
- Data collected by mobility service providers.
They identify the repurposing priorities via land use and urban planning reports.
If data about key parameters are unavailable or outdated, urban planners:
- Use data from another city with similar characteristics (e.g., similar size, population, and land use).
- Estimate the fleet size, vehicle usage, parking preference, and repurposing priorities using the proportion of the population of the area of study over the country’s population.
- Estimate key parameters based on existing trends, using the rate of increase/decrease.
- Collect data on site.
- Apply the scenario planning survey to collect inputs.
Urban planners use the results of the scenario planning survey to build scenarios. They apply the following basic steps:
- Combine the uncertainties during scenario building as it is the simplest approach; a 2-by-2 matrix containing the extremes of the 2 most important uncertainties is commonly used to create 4 scenarios [101].
- Choose a time frame and number of scenarios based on the research investigation.
- Do not build too many scenarios as analyzing the outcomes becomes more complex.
- Review the scenarios built and adjust them to best describe the target future.
The four steps of the urban space allocation method are as follows.
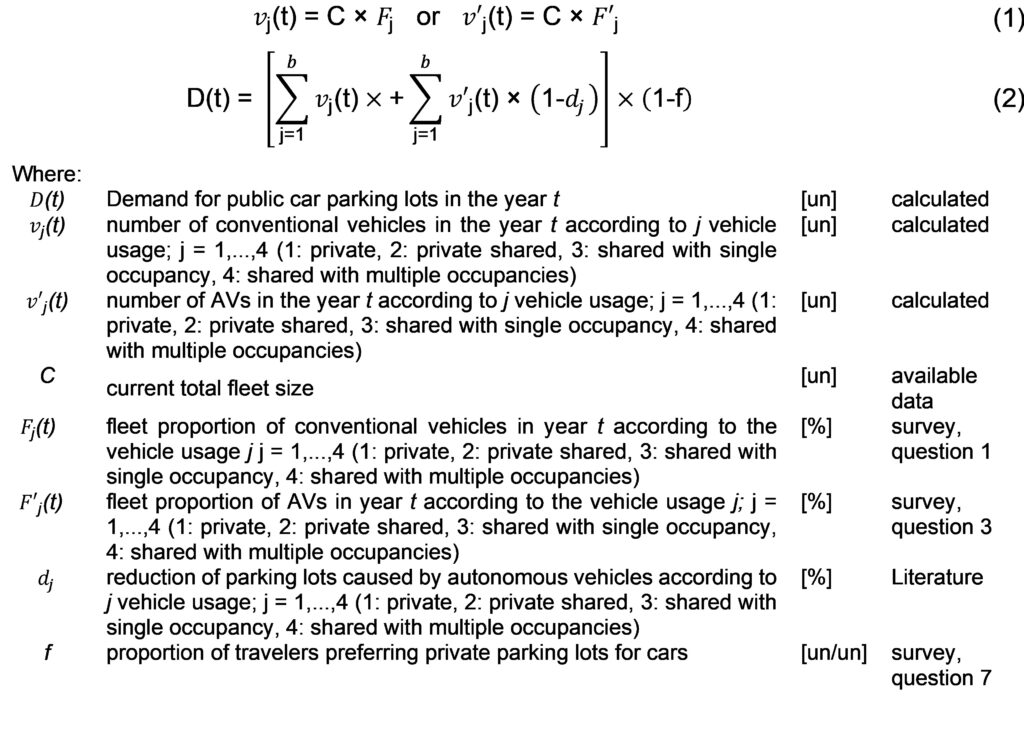
Step L1: Demand for public car parking lots [un]
Use the collected data for the parameters from Table 2 in the following equations.
Use Eq. (1) and Eq. (2) when data about vehicle usage is unavailable. In Eq. (1), the number of vehicles according to the vehicle usage (vj(t), v’j(t)) results from the proportion of answers from the scenario planning survey, and the public parking demand is calculated in Eq. (2).
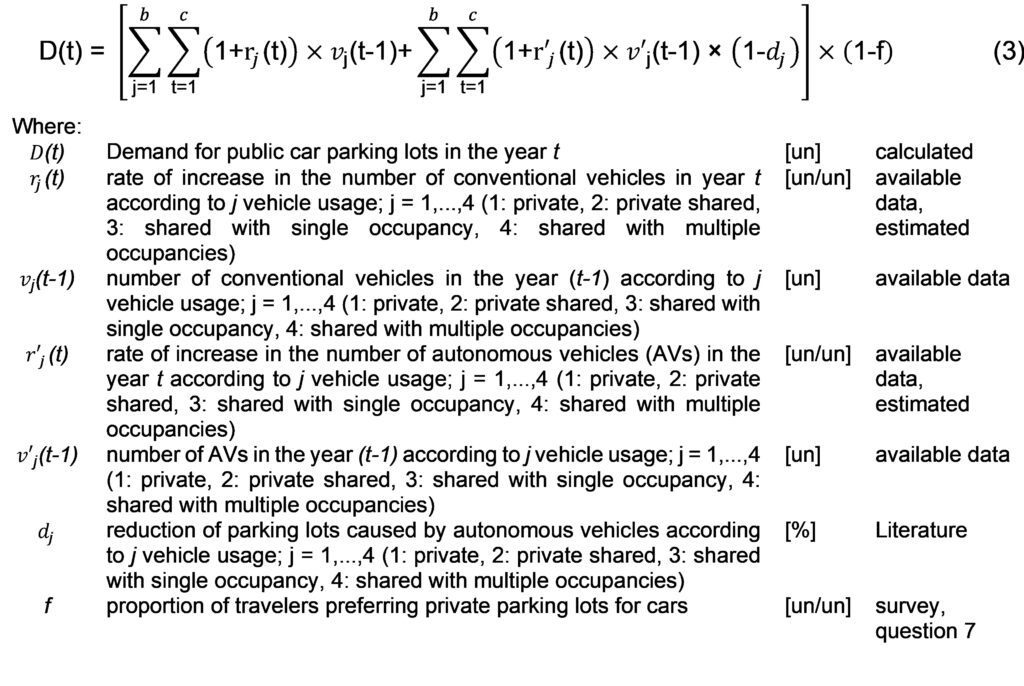
Use Eq. (3) when data are available. A yearly increment approach considering the availability of the previous year’s data or trends in the future was adopted. Hence, a rate of increase in the number of vehicles for the following year is considered.
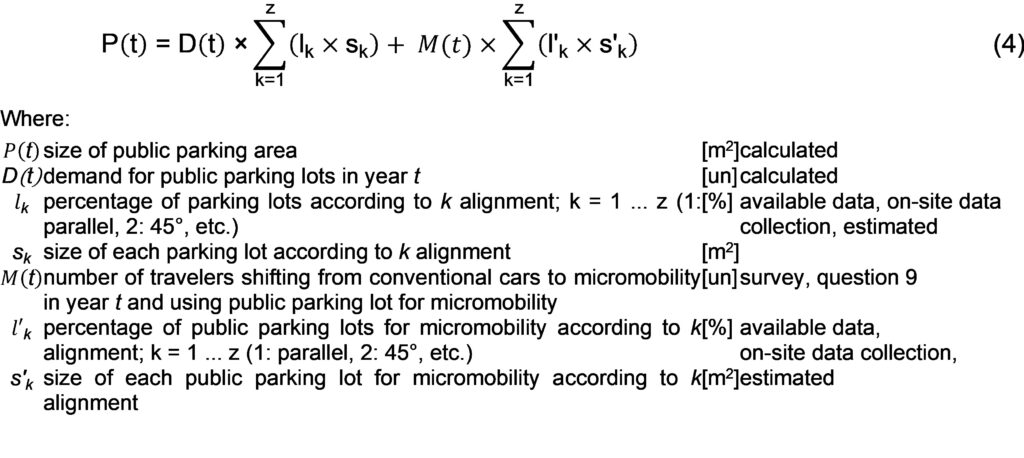
Step L2: Size of public parking area [m2]
Use the collected data for the parameters from Table 1 and Table 4 as well as the demand for public parking lots (output from Step L1) in the following equation.
Use Eq. (4) to calculate the demand for public parking area P(t) including cars and micromobility; the alignment of public parking lots and the quantity for each alignment are considered. Using this equation, the parking area difference in each alignment is tackled.
Step L3: Area of each repurposing priority
Use the collected data for the parameters from Table 3 as well as the size of the public parking area of the year in analysis (Pt output from step L2) and the previous year Pt-1 in the following equation.
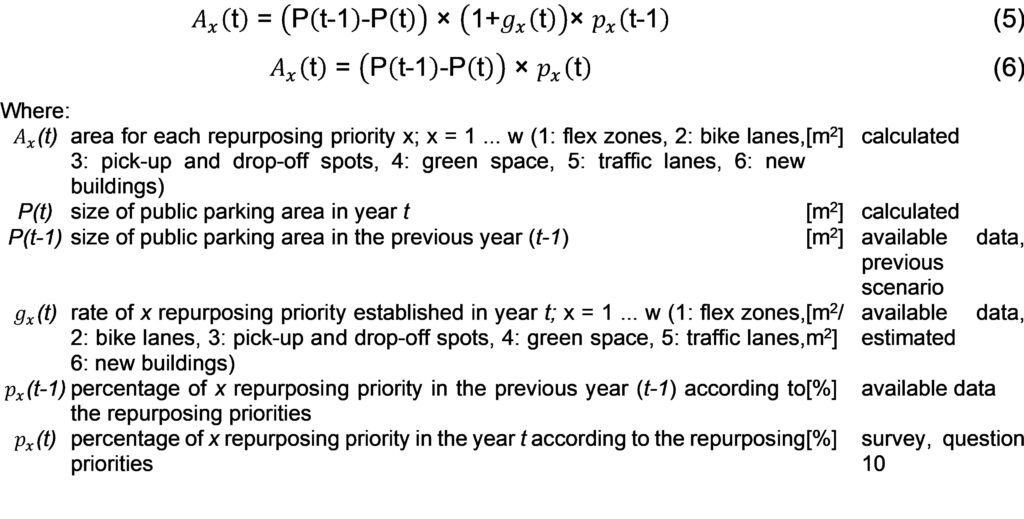
Use Eq. (5) to calculate the area for each repurposing priority Ax(t) based on the freed-up area and the proportion allocated to the repurposing priority.
Similar to parking demand calculation, use Eq. (6) to neglect the yearly increment approach during scenarios; the percentage of x repurposing priority from the survey is applied directly to the calculation and the rate of x repurposing priority gx(t) is disregarded.
Step L4: Share of public space
Use the collected data about the total area of public space in year Z(t) (Table 3) and the output of step L3 (area for each repurposing priority Ax(t)).
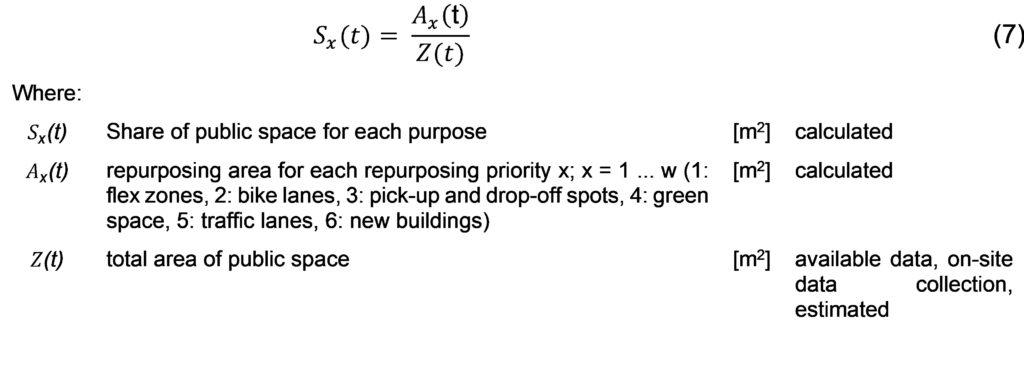
Use Eq. (7) to calculate the share of public space for each purpose Sx(t) after repurposing public parking lots. All repurposing priorities are considered as public spaces in this equation, so the total area of public spaces Z(t) is not altering. However, if the repurposing priority is not a public space (e.g., a private new building), the total area of public spaces Z(t) decreases.
Short-term planning
The modal shift to micromobility survey is applied in the short-term planning condition. In step S2, the modal shift is determined by cost, convenience, traveler’s preference and availability of transport mode, sharing and docking types [90], [91], [92]. Decision trees are used to output the possibility of modal shift after considering cost, convenience, and availability of transport mode, sharing and docking types.
The five steps of the urban space allocation method are the following.
Step S1: Current parking demand
This step is similar to the base case travel behavior in long-term planning.
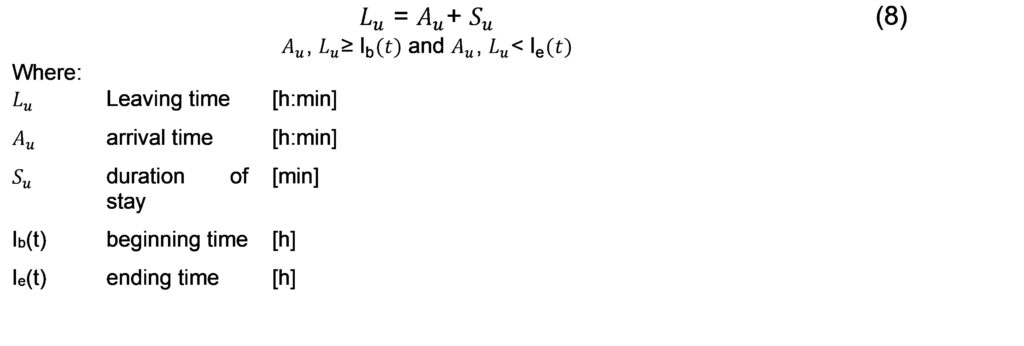
Use Eq. (8) to calculate the leaving time (Lu [h:min]) of each traveler u (u= 1..U, U⊆N) based on the arrival time and duration of stay.
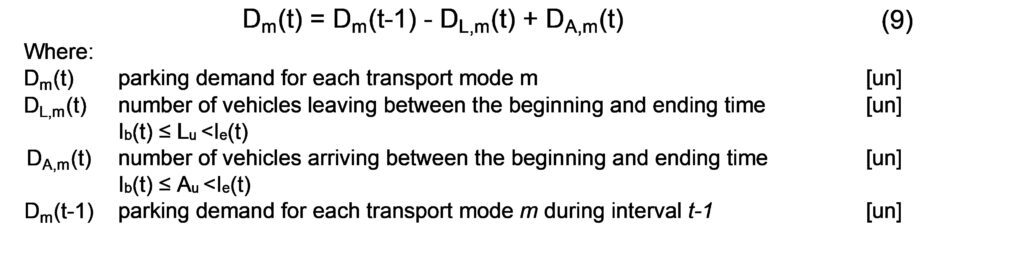
Use Eq. (9) to calculate the parking demand (Dm(t) [un]) for each transport mode m considering the number of vehicles arriving and leaving the parking area; it is considered that the transport modes arriving in the previous time interval (t-1) stay parked during the 1-h time interval t. Please note that t refers to a 1-h time interval in the short-term planning and not to year.
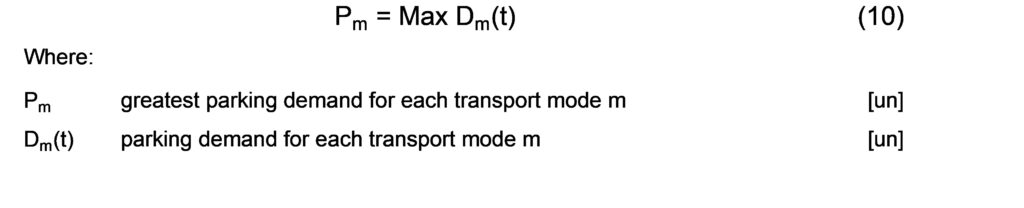
Identify the peak time of 1-h interval finding the greatest parking demand (Pm [un]) for each transport mode m (Eq. (10)); this indicates how many parking lots need to be implemented to attend to the parking demand; parking demand does not exceed parking supply to avoid the implementation of more parking lots.
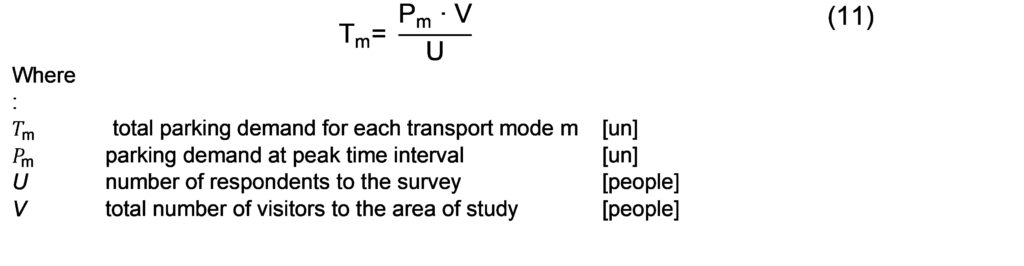
Considering the representativeness of the survey’s results, calculate the total parking demand for each transport mode m (Tm [un]) in Eq. (11) using the number of respondents (U) and the total number of visitors (V) to the area of study. The total number of visitors can be estimated according to the land use or on-site data collection.
Calculate the size of the public parking area using the same logic as Eq. (4); Tm and the size of parking lots according to the alignment are multiplied. The total size of the public parking area is the sum of all transport modes which is the output of this step.
Step S2: Decision-making factors
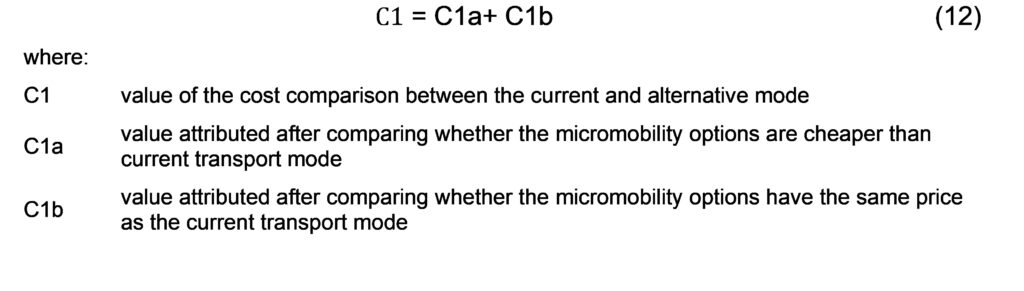
Perform sub-step C1 – cost comparison /2.1/ (Appendix – Decision-making Factors Figure D-1), evaluating the willingness to shift based on whether the alternative mode is cheaper or has the same price. Questions 10 and 11 from the modal shift to micromobility survey are inputs for parameters C1a and C1b in Eq. (12).
- If C1>2, perform the next sub-step C2 – convenience comparison /2.3/ because there is a chance of modal shift; the alternative transport mode is cheaper or has the same price as the current transport mode.
- If the respondent answers that the modal shift would be low convenient (input C2 from question 11), consider that the modal shift is not estimated because low convenience is one of the barriers to shift /2.5/. Otherwise, perform the cost-convenience relationship (R) /2.6/ in Step 2.2. – Part 2. Use Eq. (13) to calculate the cost-convenience relationship, applying the AND rule.
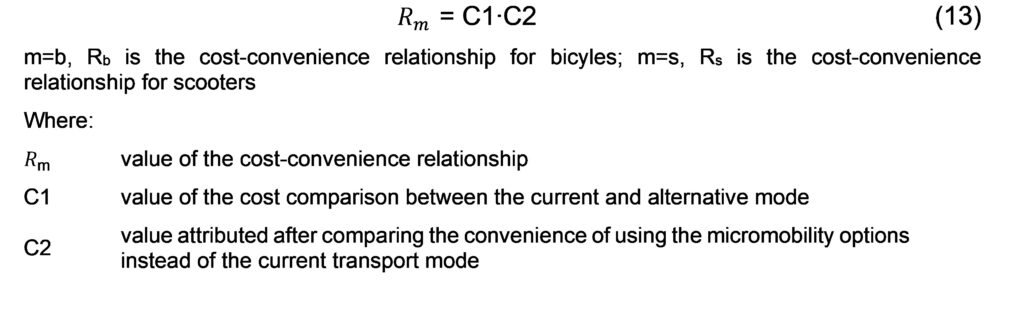
Identify the maximum value between the alternative modes (bicycle or scooter) – Max (Rb, Rs), indicating the first-best alternative transport mode /2.7/.
Compare the first-best alternative (transport mode, sharing and docking type) with the current transport mode /2.8/. If they are the same, no modal shift resulted from /2.9/, the current mode is used /2.10/. Otherwise, following the order of importance for the inputs affecting modal shift, the user’s preference and availability are investigated. Availability of the preferred transport mode, sharing and docking type are checked /2.11 to 2.20/.
Compare all best alternatives to the current transport mode in this part of the method to check the possibility of modal shift /2.21 to 2.23/. If none of the alternatives are appropriate, end the process and the current transport mode, sharing and docking type remain. The output of this step is the possible modal shift to micromobility or not. In case the output of the decision tree is the current transport mode, conclude that there is no possibility of modal shift, and do not perform the next step S3. This result will not influence the reduction of the parking area and, thus, the space to be repurposed.
The second alternative /2.21/ might not exist in some cases due to respondents:
- Considered only one option for the modal shift in the survey.
- Rejected the modal shift because of the cost.
- Evaluated the shift as low convenient.
Step S3: Likelihood of modal shift
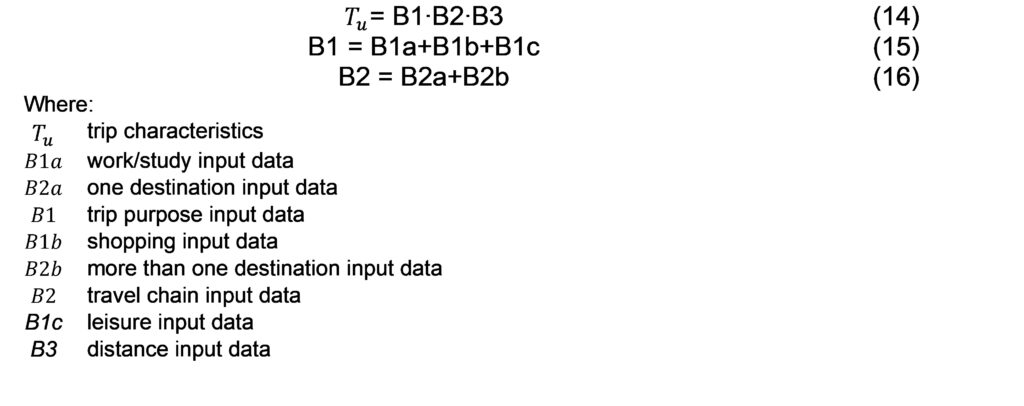
Use the results of section B Trip Characteristics from the modal shift to micromobility survey (questions 4 to 9) as inputs in the calculation of likelihood. The AND rule is used in Eq. (14) and the OR rule is used to express the value of B1 in Eq. (15) and B2 in Eq. (16). Therefore:
Calculate trip characteristics Tu.
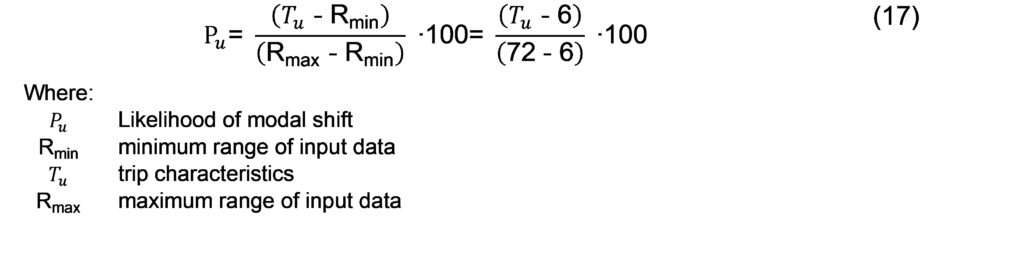
Calculate the likelihood of modal shift (Pu [%]) to micromobility using Eq. (17).
Determine the minimum likelihood (Pmin) to assume the modal shift; this is based on the planner’s conservatism.
Compare Pu with Pmin. The output of this step is the conclusion of modal shift if PuPmin. The planner’s conservatism may decrease over the years due to gradual changes in modal shift to micromobility and more available data. Hence, scenario building is also possible with variations in the minimum likelihood; however, it is out of scope in this research.
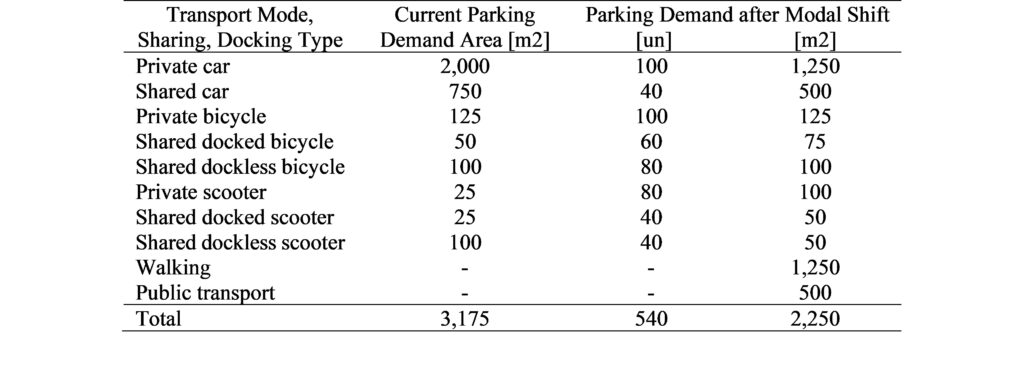
Step S4: Parking demand after modal shift
Calculate the parking demand after the modal shift similarly to in step S1 current parking demand. For the travelers with modal shift to micromobility, the area of parking demand alters.
Step S5: Repurposing
Compare the areas of current parking demand and the parking demand after the modal shift, concluding whether urban space repurposing is possible from the freed-up car parking lots. The output of this step is the amount of space to be repurposed. Attribute the repurpose priority to the freed-up space.
Method for Urban Space Allocation – Case Study
Long-term planning
I have applied the scenario planning survey, gathering answers from 150 respondents. I have used the sections from the survey:
- Base case travel behavior: the vehicle usage in 2020 was collected, revealing mostly private conventional vehicles usage. I have used the base case 2020 as a starting point to compare with scenarios.
- Willingness to change: I have used the results for the vehicle usage to build the scenarios for years 2025, 2035, and 2045.
I have built 4 scenarios for a 30-year period (2025, 2035, 2045, 2055) to describe the gradual shift from conventional vehicle use to a full SAVs fleet. I have combined the uncertainties of AVs acceptability and sharing using different types of vehicle usage. The fleet size for each type of vehicle usage (Fj or F’j [%]) is a proportion to the current total fleet size (C [un]); this proportion is collected from the scenario planning survey. Figure 2 shows:
- Fleet composed only of conventional vehicles in the years 2020 and 2025.
- An increase in the use of private conventional vehicles from 2020 to 2035.
- 50% of the fleet with AVs from 2035 and the fleet composed of conventional vehicles and AVs indicating a transition period.
- More than 50% of the fleet is SAVSO in 2045, and all the fleet is composed of SAVs in 2055.
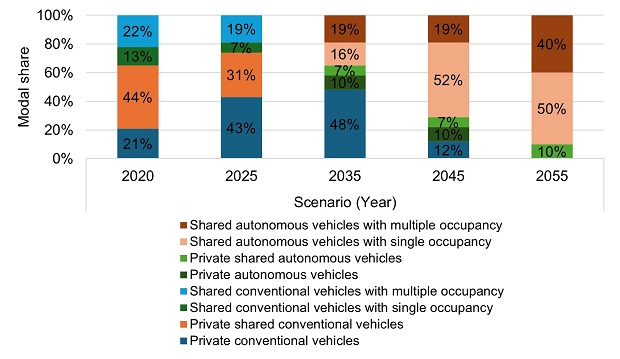
Figure 2 – Scenarios.
I have built the scenarios as follows:
- Scenario 2025 – increased private vehicle usage of conventional vehicles; fleet proportion results from the scenario planning survey (willingness to change section).
- Scenario 2035 – simulating a transitional period in which around 50% of the fleet is composed of AVs. Scenario 2035 exhibits alterations in the attributes from Scenario 2025, except for 19% SAVMO. The inputs were:
- 48% conventional vehicle fleet – 48% of respondents reject the use of autonomous vehicles.
- 16% SAVSO – resulted from the sum of 9% of respondents rejecting a shared service with multiple occupancies with 7% of SAVSO from Scenario 2025.
- 10% private and 7% PSAV – I have allocated the remaining 17% proportionally to the values of private AV and PSAV from Scenario 2025.
- Scenario 2045 – I aimed to investigate the results of parking demand in a scenario with more than 50% of the SAVSO fleet. The inputs were:
- 12% conventional vehicles – I have considered the average of 12% between 11% of respondents reject the use of AVs in any circumstances and 13% of conventional vehicle fleet by 2045 [74].
- I have kept some of the projections for Scenario 2035 (10% private AV, 7% PSAV, and 19% SAVMO).
- 52% SAVSO – I have allocated the remaining 52% considering that people with previously rejecting attitudes to use AVs and shared services would change.
- Scenario 2055 – I aimed to investigate the results of parking demand in a scenario with all SAV fleet considering the forecast of car fleet with over 90% SAV by 2055 from existing literature [75] and increased use of multiple occupancies. The inputs were:
- 40% SAVMO – based on [50] to illustrate the substantial increase in the utilization of shared multiple occupancies;
- 10% PSAV – I have considered the shift to shared use of 10% private AV in Scenario 2045 following a gradual change;
- 50% SAVSO – the remaining proportion will be single occupancy [52].
Using the scenarios, I have analyzed the parking demand with a fleet of only conventional vehicles, conventional vehicles and AVs, and only AVs. The scenario planning survey can be reapplied in 2025 to update the results of Scenario 2025. As a result, 2025 results will compose the new base case.
I have used the following criteria when selecting the area of study:
- The presence of car public parking lots; 2,496 parking lots (n1= 1,350 public and n2= 1,146 private with access to the public).
- Residential area with commercial services to explore several repurposing priorities.
I have drawn some conclusions based on these results. The validity of these conclusions is limited to the area of study and depends on the data validity. Hence, the data collection methods such as the survey are relevant. The area of study is an old area in the city of Budapest with 150 years old approximately; the buildings do not have garages and car owners have to use public parking lots. The results for each step are as follows.
Step L1: Demand for public car parking lots [un]
I have considered the total supply of public parking lots in the base case (year 2020) as the fleet size to represent the base case situation (C= 1,350). . I have presented the results of the application of the model for Scenario 2035. Data were from survey answers, thus, Eq. (1) and Eq. (2) were used. The inputs and results for Scenario 2035 are in Table 2-6 and Table 2-7.
Table 2-6 – Scenario 2035 inputs in Equation 2.
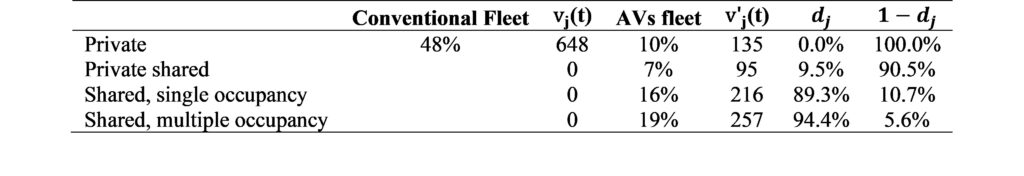
Table 2-7 – Scenario 2035 outputs from step L1 and L2.

Step L2: Size of public parking area [m2]
I have collected the area of a parking lot for each alignment (0°, 45°, and 90°)
sk and their percentage of parking lots lk via on-site data collection (Eq. (4)). The total public parking area for cars available in the area of study equals 21,053 m2. The demand for public parking area for cars in Scenario 2035 is in Table 2-7.
Only Scenario 2035 and Scenario 2045 are considered as 48% and 12% of the fleet is composed of private conventional vehicles, respectively. I have considered that one car parking lot with parallel alignment (12.5m2) will be used by 10 travelers shifting to micromobility. The results for 2035 with modal shift are in Table 2-8.
Table 2-8 – Scenario 2035 (f=0) outputs with shift to micromobility.
In Figure 2-5, the main findings derived from the application considering only the car parking demand in the calculation are (f=0):
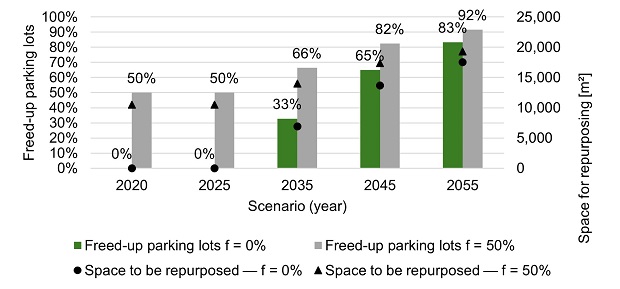
Figure 2-5 – Freed-up public parking lots.
- Scenario 2025: public parking lots are not freed up due to the decrease in shared conventional vehicles use, thus, the demand for public parking lots remains the same.
- Scenario 2035: one-third of the public parking lots (443 parking lots) are freed up with 35% SAV in the fleet (SAVSO and SAVMO).
- Scenario 2045: around two-thirds of the public parking lots (877 parking lots) are freed up with 71% SAV in the fleet (SAVSO and SAVMO), double of Scenario 2035.
- Scenario 2055: around 83% of public parking lots (1,125 parking lots) are freed up with 90% SAV in the fleet (SAVSO and SAVMO).
For each scenario, Figure 2-5 presents the number of freed-up public parking lots considering the use of public parking lots (f=0) and private parking lots available for public use (f=0.5). Results of Figure 2-5 answer the question regarding the modal shift to SAVs: “What is the reduction in parking demand caused by the modal shift towards SAVs and micromobility?”. The use of SAVs increases from Scenario 2035 resulting in a reduction of parking demand (33% to 83% freed-up parking lots).
The main conclusions are:
- The shift from private conventional vehicles use to private AV does not reduce parking demand.
- Parking lots are freed up proportionally to shared vehicle usage and higher vehicle occupancy contributes to the reduction in parking demand.
- The use of private parking lots is a solution to free up public parking lots if shared vehicle usage is rejected.
I recommend:
- The implementation of space and time limitations in public parking lots for private AV use, consequently, encouraging private AV owners to offer their vehicles to SAV services while not in use or acquire a private garage to store the vehicles.
- Offering value-added services in private parking lots (e.g., charging, maintenance, and cleaning) to enhance their adoption over public parking for private AV owners and SAV service operators.
- The implementation of customized fees in private parking lots considering parking time, convenience, and security aspects increases the willingness to pay as they tend to be more expensive than public parking lots.
Outcomes vary based on the city’s specificities such as settlement structure and the preferences of the population for fleet, vehicle usage, and parking preference. Nevertheless, the outcomes resulting from the increased utilization of SAVs and freeing up parking lots to be repurposed have been demonstrated.
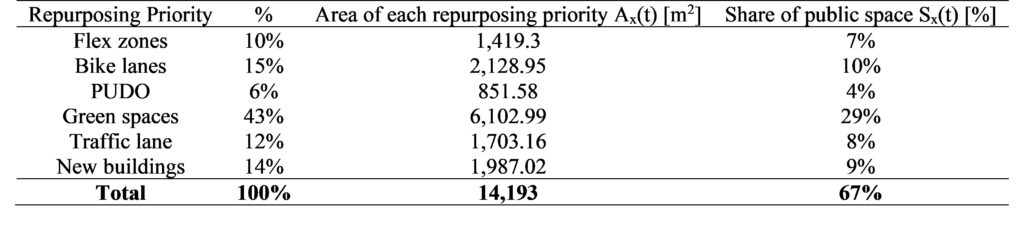
Step L3: Area for each repurposing priority
Priorities 1 are assigned to Scenario 2035, priorities 2 to Scenario 2045, and priorities 3 to Scenario 2055. For example, pxt for priority 1:
- 10% of respondents prefer to repurpose the freed-up parking lots as flex zones,
- 15% as bike lanes,
- 6% as pick-up and drop-off areas for shared mobility services.
- 43% as green spaces,
- 12% as an additional traffic lane, and
- 14% as new buildings.
As priority 2 and so on, these percentages change.
To calculate the area for each type of repurposing in Scenario 2035 using Eq. (6):
- P(t-1) = 21,053 [m2]
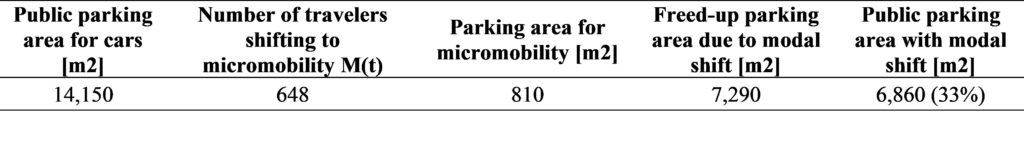
- P(t) = 6,860 [m2]
The area for each repurposing priority and its share of public space for Scenario 2035 considering the modal shift to micromobility are shown in Table 2-9.
Table 2-9 – Area for each repurposing priority and shares of public space in 2035.
Step L4: Share of public space
The share of public space for Scenario 2035 is shown in Table 2-9. The answer to the question “What is the future share of public space?” is 67% of the total public share for repurposing priorities; green space (29%), bike lanes (10%), and new buildings (9%) are the top 3 public shares for repurposing.
- Short-term planning
I have considered fictive answers from 100 respondents. The data from the survey and current parking demand were randomly created using the JavaScript language. The total number of visitors to the area equals 2.000. It was supposed that users of the area arrive and leave between 8 a.m. and 6 p.m. The minimum likelihood for modal shift expected is 50%.
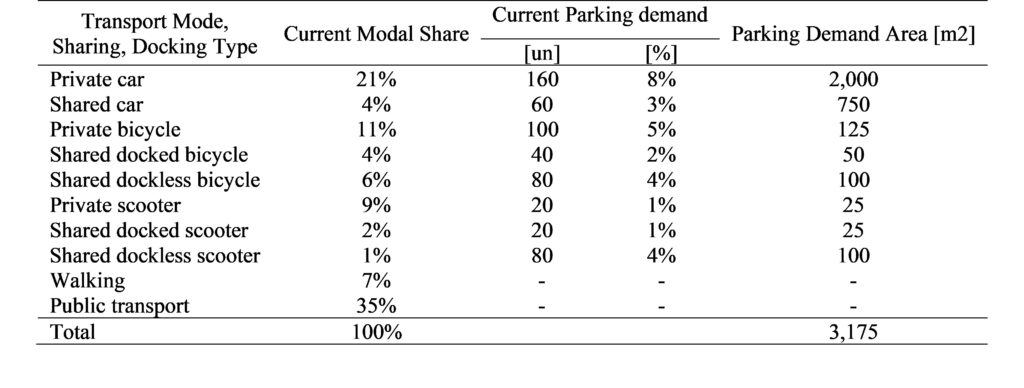
Step S1: Current parking demand
The current parking demand in units and area is presented in
Table 2-10. I have considered one car parking lot equals 12.5 m2 and 10 bicycles or scooters fitting in one car parking lot.
Table 2-10 – Current parking demand at peak time.
Step S2: Decision-making factors
For each respondent, the possible modal shift is evaluated. Considering a respondent with a current private car as transport mode answering the survey to shift to bicycle:
- Question 10: yes, so C1a is 2.
- Question 11: yes, so C1b is 2.
- Question 12: medium, so C2 is 2.
Shifting to bicycle is the first-best alternative. The respondent’s preference is for a private bicycle and the transport mode is available as the user possesses one. The output of this step is that there is a possible modal shift.
Step S3: Likelihood of modal shift
The respondent has the following answers in the survey:
- Questions 4 to 6: Yes, so B1 equals 6.
- Questions 7 and 8: Yes, so B2 equals 4.
- Question 9: short-distance, so B3 equals 3.
The likelihood of modal shift (Pu [%]) is 100% in this case.
Step S4: Parking demand after modal shift
Considering the modal shift from private car to private bicycle, the user will need 1.25m2 for parking instead of 12.5m2 previously.
Step S5: Repurposing
The amount of space to be repurposed is 11.25m2. Steps S2 to S5 are repeated for all respondents and the total amount for the study area is calculated. Table 2-11 shows the result of the parking demand area after the modal shift and the amount of 925 m2 to be repurposed to green spaces as the first repurposing priority.
The repurposing priorities are the establishment of green spaces and bike lanes [111] which is in line with new urban models prioritizing a city for people and not for cars [112]. Hence, spaces for increasing the community’s mental health and reduction in air pollution [111], [112] are generated, and a modal shift to micromobility through available cycling infrastructure is encouraged [113]. The exchange of parking to PUDO due to SAV use, increased micromobility parking demand due to modal shift, and other future needs require urban space allocation in an optimized way through flex zones [8], [114].
Table 2-11 – Parking demand after modal shift.
Method for Urban Space Allocation – Surveys
Scenario Planning Survey
Base Case Travel Behavior
- Mark the sentence which best describes you (Evaluation: Current vehicle usage):
- I have my own car (Private)
- I share the vehicle with members of the family (Private shared)
- I drive a shared car (Carsharing with single occupancy)
- I take a taxi (Sharing with single occupancy)
- I share the same vehicle with other people (Ridesharing/Carsharing with multiple occupancy)
- Choose the two most used (please consider the number of trips) modes by you (Evaluation: Current modal share):
- Public Transport
- Bicycle
- Walking
- Car as a driver
- Car as a passenger
- Taxi
- Motorbike
- Carsharing
- Bike-sharing
- Ridesharing as a passenger
- Ridesharing as a driver
Willingness to change
- Are you willing to change your current vehicle usage by 2025? Vehicle usage: you own a car, you share a car with member of your family, you use carsharing or ridesharing (Evaluation: future vehicle usage, sharing acceptability):
- No, the current option will remain.
- Yes, I would buy my own car (private ownership).
- Yes, I would share my car with members of my family in order to reduce the number of cars that we have (private shared ownership).
- Yes, I would use taxi or carsharing as a driver (shared with single occupancy ownership).
- Yes, I would use ridesharing as a driver (sharedwithmultiple occupancy).
- Yes, I would use ridesharing as a passenger (shared with multiple occupancy).
- How likely will you use an autonomous vehicle in 2035? (Evaluation: traveler acceptability):
- None
- Very unlikely
- Unlikely
- Likely
- Very likely
- Mark the options which describe you best when completing the sentence: I would use AVs… (Evaluation: Situations in which respondents would use AVs, adapted [242]):
- To avoid parking
- When personal vehicle is unavailable (maintenance or repairs)
- As an alternative to driving (e.g., after drinking alcohol)
- For long trips
- For short trips
- Other
- Never
- Mark the options which describe you best when completing the sentence: I would share an AV with someone at the same time . . . (Evaluation: Situations in which respondents would use SAVs with multiple occupancy, adapted [242]):
- When riding alone
- When riding with an adult family member or friend
- When riding with my child
- Only at times of day I think are safe
- For work
- For shopping
- For recreational trips
- For all trips
- I would not use the service
Parking
- Choose the most used (please consider the number of parking sessions) car parking facility type by you (Evaluation: confirming if public parking is the most used):
- Private parking at home (e.g., garage)
- Private parking (e.g., a paid building garage which has a private owner)
- Workplace
- Public parking (e.g., curbside)
- Supermarkets, markets, shops
- Parking and Ride (P + R) parking facility
- Choose the most used (please consider the number of parking sessions) micromobility parking facility type by you (Evaluation: confirming if public parking is the most used):
- Private parking (e.g., garage)
- Private parking (e.g., a paid building garage which has a private owner)
- Workplace
- Public parking (e.g., bicycle racks or geofencing)
- Supermarkets, markets, shops
Modal Shitf to Micromobility
- Mark the option which describes you best when completing the sentence: As I will not use autonomous vehicles, I would …
- keep my current vehicle usage
- shift to a shared conventional car
- shift to a private bicycle
- shift to a shared docked bicycle
- shift to a shared dockless bicycle
- shift to a private scooter
- shift to a shared docked scooter
- shift to a shared dockless scooter
- public transport
- walking
Repurposing priorities
- If public parking lots could be eliminated, how would you use this additional space? Order according to priority, 1 is the highest priority and 9 is the lowest priority (Evaluation: identifying the priorities of decision-makers regarding changes in urban space):
- New buildings
- Additional traffic lane
- Green spaces (e.g., gardens and parklets)
- Pick-up and drop-off points
- Bike lanes
- Flex zones (loading/unloading, food trucks, parklets)
Socioeconomic Data
- Age
- 18–35
- 36–60
- >60
- Gender
- Female
- Male
- Other
- Do you have a driving licence?
- No
- Yes
- Employment
- Student
- Self-employed
- Employee in a private company
- Employee in the public sector
- Retired
- Adults in the household
- 1
- 2
- >2
- Children in the household
- 0
- 1
- 2
- 3
- >3
- Education level
- Studied until high school
- Technical College
- Bachelor’s degree
- Master’s degree
- Doctoral degree
- Income level per person (HUF) per month
- <=100,000
- 100,001–200,000
- 200,001–300,000
- 300,001–400,000
- 400,001–500,000
- >500,000
Modal Shift to Micromobility Survey
The modal shift to micromobility survey is presented below.
A. Travelers’ preferences
- What is your preferred transport mode? (Parameter A1)
- Private car
- Shared car
- Bicycle
- Scooter
- Public transport
- Walking
- What is your preferred sharing mode? (Parameter A2)
- Private
- Shared
- What is your preferred docking type? (Parameter A3)
- Docked
- Dockless
B. Trip characteristics
- Would you use bicycle or scooter to go to work/study? (Parameter B1a)
- No (1)
- Maybe (1.5)
- Yes (2)
- Would you use bicycle or scooter to go shopping? (Parameter B1b)
- No (1)
- Maybe (1.5)
- Yes (2)
- Would you use bicycle or scooter to leisure? (Parameter B1c)
- No (1)
- Maybe (1.5)
- Yes (2)
- Would you use bicycle or scooter for two trips? (Parameter B2a)
- No (1)
- Maybe (1.5)
- Yes (2)
- Would you use bicycle or scooter for more than two trips? (Parameter B2b)
- No (1)
- Maybe (1.5)
- Yes (2)
- How is the distance of your trips classified? (Parameter B3)
- Short-distance (3)
- Medium-distance (2)
- Long-distance (1)
C. Decision-making Factors (Values for the modal shift calculation are between parentheses)
- Is using bicycle or scooter cheaper than your current transport mode? (Parameter C1a)
- No (1)
- Maybe (1.5)
- Yes (2)
- Is using bicycle or scooter the same price as using your current transport mode? (Parameter C1b)
- No (1)
- Maybe (1.5)
- Yes (2)
- Comparing your current transport mode with a bicycle or scooter, what is the level of convenience of using a bicycle or scooter? (Parameter C2)
- Low (1)
- Medium (2)
- High (3)
- Is bicycle or scooter available to be used during your trips? (Parameter C3 – logical variable)
- Yes
- No
D. Mode choice
- What is your current transport mode?
- Private car
- Shared car
- Bicycle
- Scooter
- Public transport
- Walking
- What is your preferred sharing mode?
- Private
- Shared
- What is your preferred docking type?
- Docked
- Dockless
E. Time
- What is the arrival time in the area of study?
- What is the duration of stay in the area of study?
Novel Locating Method for Multifunctional Flex Zones – Attributes
System Model for Flex Zones
Identify the main elements and their attributes in the spatial system model for flex zones. The spatial system model was established for flex zones considering the following main elements:
- Flex zones,
- Micromobility parking lots,
- Logistics parking lots for unloading/loading goods,
- POIs,
- Area of study.
I have determined the spatial system model for flex zones based on [138]. The center of the coverage area is the flex zone instead of the bike station. The walking radius determines the size of the coverage area and which POIs are served by the flex zone in the center. Due to the presence of a walking radius, the SAV mobility service is a nearly door-to-door service.
To locate multiple flex zones, use the coordinates of the centroid in the car parking area. Then, sum up the number of flex zones available in the area (in italics in Figure 3-2a). The numbers next to POIs show the number of flex zones needed to meet the parking demand at the peak time interval. The peak time interval is when the parking demand is the highest. Parking demand for cars, micromobility, and logistics are analyzed separately.
Figure 3-2 shows the elements and attributes I have considered in the spatial system model for flex zones. Attributes of a flex zone are indicated in italics, attributes of an area of study for scenario S are indicated in bold, and the remaining attributes refer to POIs.
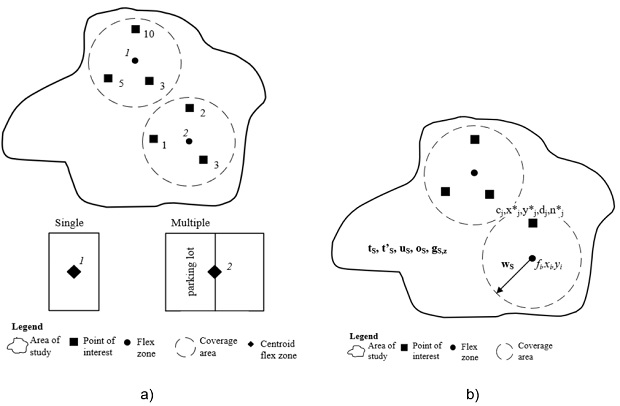
Figure 3-2 – Spatial system model for flex zones a) Elements, b) Attributes.
I have summarized the attributes in Table 3-1 to Table 3-5. Attributes of logistics and micromobility parking refer to existing infrastructure. When attributes are time-dependent, they refer to the peak time interval.
Table 3-1 – Attributes of flex zones.

The sum of potential flex zones with location type fi is mfi [un].
I have considered the location types for flex zones:
- Private parking opened for the public (e.g., shopping malls, supermarkets) and curbside (i.e., on-street parking lots) for flex zones with PUDO, micromobility, and logistics priorities.
- On road lane (temporal) for flex zones with PUDO and logistics priority. They are designated by paintings on the pavement, at least 3-5m from the corners of a street, and their coordinates are recorded so vehicle operators of SAVs identify their location via GPS.
Obtain parking demand data during on-site data collection or from cities’ reports. For the future parking demand, forecast it based on historical data or trends.
Table 3-2 – Micromobility parking lots attributes.

Table 3-3 – Logistics parking lots attributes.

Table 3-4 – POI attributes.
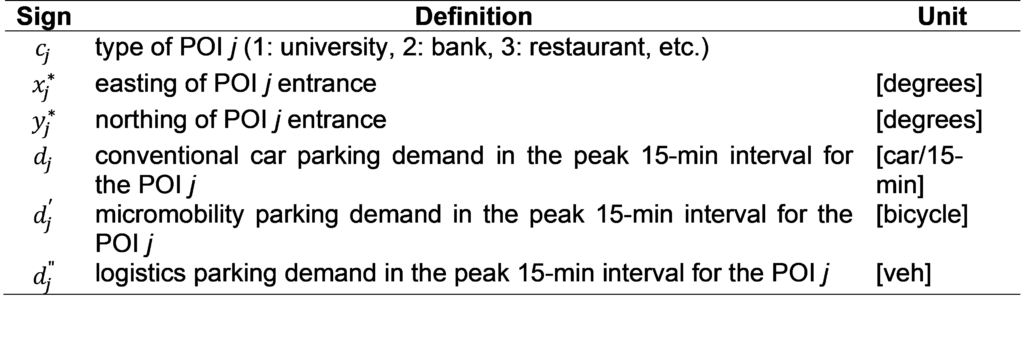
Table 3-5 – Attributes of an area of study for scenario S

Collect all attributes of an area of study via survey responded by users or providers of the area of study. The average time for boarding/alighting and the average pooling rate can be also gathered via on-site data collection. The method needs data input; thus, the results of elements and attributes are used to depict the demand and supply of flex zones.
I have depicted the supply and demand separately during the determination of the spatial system model for flex zones. The supply of car, micromobility, and logistics parking lots as well as the parking demand for flex zones in the area of study are considered in the method. Parking demand calculation for each POI is out of scope in this study as I have considered it will be available or forecasted in the future. Hence, vehicle attraction rates of POI types from the literature are used in the case study.
Novel Locating Method for Multifunctional Flex Zones – Steps
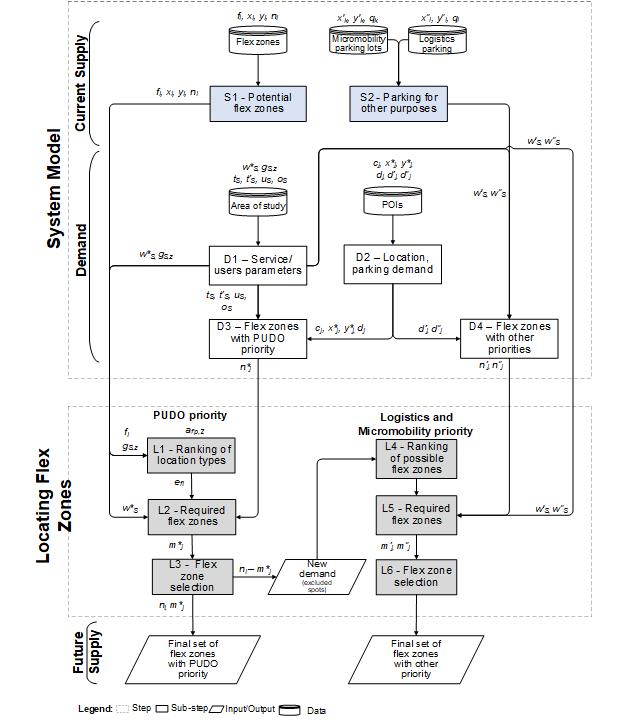
I have explained the steps of supply and demand depiction in the following paragraphs.
- Supply
Use the following 2 steps to identify numerically the attributes of the supply of flex zones:
- S1 – Identifying potential flex zones: attributes from Table 3-1.
- S2 – Identifying existing parking lots for other purposes: attributes from Table 3-2 and Table 3-3.
- Demand
Use the following 2 steps to identify numerically the attributes of the demand of flex zones:
- D1 – Identifying mobility service and users input parameters: attributes from Table 3-5.
- D2 – Identifying POIs location and their parking demand: attributes from Table 3-4.
I have considered the peak time interval as 15 min. The average pooling rate os is increased by boosting travelers’ motivation to accept a shared service.
The required capacity of flex zones to attend to parking demand for each POI according to the priorities is calculated in steps D3, D4, and D5.
D3 – Calculating the required capacity of flex zones with PUDO priority for POI j, in scenario S (Eq.(18))

In steps D4 and D5, the required capacity of flex zones with logistics and micromobility priorities is calculated considering the:
- Size of vehicles used during the peak parking demand for each POI.
- Demand attended by existing infrastructure of logistics and micromobility parking lots.
The logic of a coverage area considering the willingness to walk is used to know if the POI is attended by an existing infrastructure. The existing infrastructure is placed in the center.
Results of the calculation are rounded up to the next integer as the reservation system considers the entire flex zone dedicated to a single priority during the peak.
D4 – Calculating the required capacity of flex zones with micromobility priority for POI j, in scenario S (Eq.(19))
For micromobility, I have considered the bicycle size as the basis, thus, a car parking lot fits around 10 bicycles ([bicycles/un]) in Eq.(19).

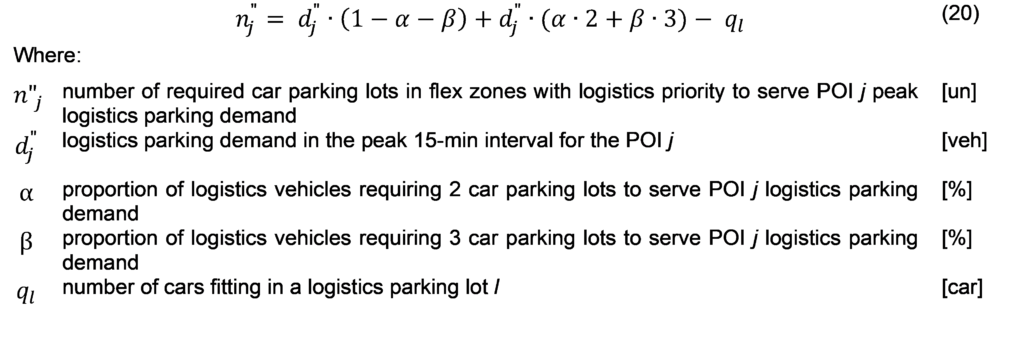
D5 – Calculating the required capacity of flex zones with logistics priority for POI j, in scenario S (Eq.(20))
For logistics, the base size is a vehicle fitting in an ordinary car parking lot (Eq.(20)). Consequently, a longer vehicle or the use of a ramp for unloading/loading will require additional car parking lots to be booked. In Eq.(20), 2 and 3 represent the number of car parking lots per logistics vehicle ([car/veh]) according to their length.
- Locating Flex Zones
I have tackled the supply-demand reconciliation throughout the steps of locating flex zones. Locating flex zones is divided into:
- Locating flex zones with PUDO priority to serve SAVs mobility. It fulfills the future need of PUDO infrastructure for AVs pointed out in [119].
- Serving other parking demands such as flex zones with logistics or micromobility priority. It tackles the lack of sufficient parking lots for logistics activities and the rise in micromobility use due to modal shift.
- PUDO priority
The locating method for flex zones with PUDO priority is composed of 3 steps. The detailed flowchart containing the steps, iterations A and B, decision points and inputs/outputs, is presented in Figure F-1 – Appendix – Steps of the locating method.
I have applied the following limitations:
- SAV mobility service replaces entire individual passenger car traffic; no modal shift from public transport or micro-mobility to SAV is assumed.
- Feeder service is neglected, so the time interval of PUDO sessions is not related to the schedule of public transport.
The steps of the locating method for PUDO flex zones are:
L1 – Ranking of location types for flex zones with PUDO priority
The location types are ranked by urban planners using a flexible multicriteria evaluation method. This part of the method is flexible because different criteria are to be used depending on the area of study; the criteria are defined by decision-makers considering the objectives for service, users, and urban space. To rank the location types:
- Define the criteria.
- After identifying the location types in step S1, define a scale from 1 to the number of location types; as the number in the scale grows, the location type fi becomes more beneficial to criterion z.
- Create a table with the location types in rows and criteria in columns, and assess the location types according to the criterion using the scale. afi,z is the assessment value of location type fi considering criterion z.
- Use Eq. (21) to evaluate the location types.

- Rank the location types according to the evaluation values in descending order. The highest evaluation value indicates the first-best location type b (1: first-best, 2: second-best, 3: third-best, etc).
L2 – Required capacity of flex zones with PUDO priority in the coverage areas
To calculate the required capacity of flex zones in the coverage area:
- Choose a potential flex zone with the first-best location type randomly.
- Calculate the distance between this potential flex zone and all the POIs using their coordinates in the Haversine formula [139].
- Assign the POI to the coverage area of the flex zone if the distance is smaller than or equal to the walking radius (namely, located within the coverage area). If POI is within several coverage areas, it is assigned to the coverage area with the smallest distance between POI and the flex zone.
- Identify the POIs with the same peak time interval within a coverage area and sum up the required capacity of flex zones (Figure 3-3). Thus, the aggregated value m*j is calculated. In case peak time intervals of POIs are different, skip this task.
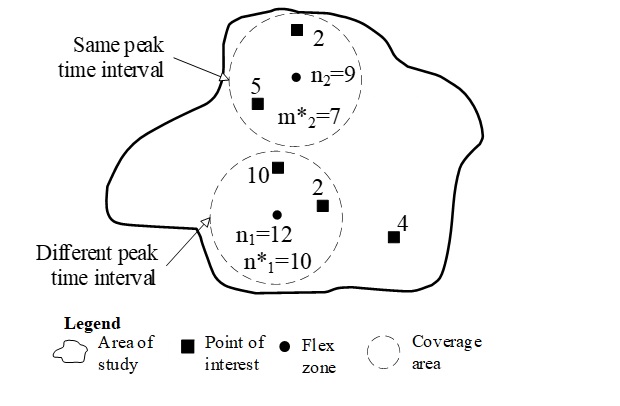
Figure 3-3 – Required capacity of flex zones.
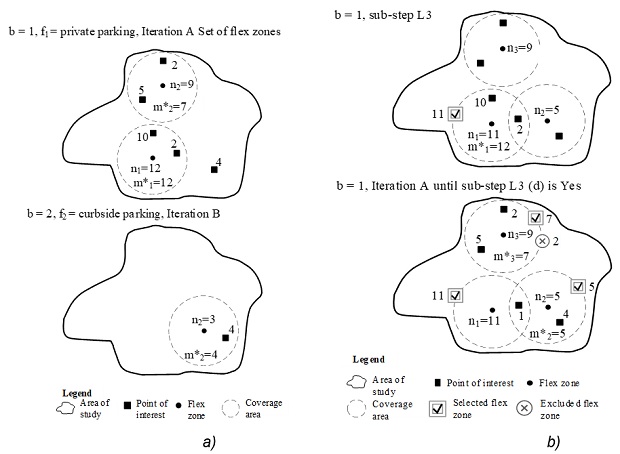
Figure 3-4 – Hypothetical result a) Required number of flex zones, b) Set after iteration.
- Identify the biggest required capacity of flex zones of a POI within the coverage area. The result is an aggregated value m*j or the calculated n*j in step D3 for each coverage area.
- Repeat this step for the remaining potential flex zones following the ranking of location types until all of them are selected (Figure 3-4a).
The output of this step (m*j or n*j) serves as input for the next step L3.
L3 – Flex zone selection for PUDO priority
The output of this step is the selection of flex zones for PUDO priority; details of steps and iterations are in Figure F-1 Appendix – Steps of the locating method– step L3 (a). To select the flex zones:
- Identify all flex zones without POIs within the coverage area and do not select them (reject). This means that these flex zones do not attend to parking demand for PUDO priority within the walking distance, so they will be examined for logistics and micromobility priorities in step L4.
- Choose randomly a flex zone containing POIs and identify if the flex zone is single or multiple (step L3 (b)). Single flex zones are always selected as I have assumed that implementation of the single parking lot has been justified previously.
- Examine the multiple zones comparing the available capacity of flex zones ni to the required capacity of flex zones in a coverage area m*j or n*j (step L3 (c)). Figure 3-4b shows a hypothetical result of Iteration A for the first-best location type.
- If the supply is equal to or bigger than the demand (ni ≥ m*j), select the required capacity (m*j), and reject the excess (ni – m*j). Otherwise, select the available capacity of flex zones ni. It means that if the supply is smaller than the demand, the required capacity of flex zones will not be fulfilled. The rejected flex zones will be examined for logistics and micromobility priorities in step L4.
- In the evaluation of subsequent potential flex zones with the first-best location type (step L3 (d)), consider only POIs with an unfulfilled required capacity of flex zones (Iteration A). Repeat previous tasks 2-4 until the set of selected flex zones for PUDO priority within the examined best type is revealed.
- Repeat the steps L3 (a)-(e) for all potential flex zones following the ranking of location types for PUDO flex zones (Iteration B). In the end, the final sets of selected and rejected flex zones contain the capacity and location of flex zones with PUDO priority.
The number of rejected flex zones in the final set is used for other parking demands in step L4.
- Logistics and Micromobility Priorities
To know which other parking demand to supply first by a flex zone, use the prioritization approach from [132]. The steps for locating flex zones with other parking demands are performed for the first priority of functions. They are repeated until all functions have their final set of flex zones. The steps follow the same logic of locating flex zones with PUDO priority. The steps are:
- L4 – Ranking possible flex zones for other parking demands
- L5 – Required capacity of flex zones with other parking demands in the coverage area
The willingness to walk w’S or w”S from step D1 and the required capacity of flex zones from D4 are used as inputs. L5’s outputs m’j or m”j are used in step L6.
- L6 – Flex zone selection for other parking demands
The model can be adapted to different urban contexts. For low-density and suburban areas, the walking radius is increased as residents usually walk further to access some services. The POIs category is extended to public transport and micromobility stations, promoting the integration of SAV services with transportation options. Furthermore, several peak-time intervals are to be considered in the presence of seasonal and temporal variations affecting walkability.
Novel Locating Method for Multifunctional Flex Zones – Case Study
A case study is performed in Budapest, Hungary to prove the method applicability and results’ validity. The area chosen for the case study has land use classified as neighborhood commercial. The priority of functions is access for people, goods, and storage of vehicles. The area is flat facilitating increased walking radius. Users of the area are from various age groups, but young adults are the majority; this is favorable to the increased walking radius and reduced user’s time for boarding and alighting.
Locating flex zones with PUDO priority fulfills the function access for people. Following the priority of functions, remaining flex zones are assigned to logistics and micromobility to fulfill the functions access for goods and storage of vehicles, respectively.
The supply and demand depiction as well as the results of each step in the locating method for flex zones with PUDO priority are as follows.
S1 – Identifying potential flex zones
Five multiple flex zones in private parking (from PP1 to PP5) have been identified (shopping mall, office building, and three areas of the university) as potential flex zones. The total number of potential flex zones in the area of study is 2,948:

D1 – Identifying mobility service and users input parameters
Values of service and user’s parameters were determined based on characteristics of public transport and capacity of an ordinary vehicle:

Weight gS,z and average willingness to walk are gathered via survey. Respondents are asked to order criteria according to importance and reveal their willingness to walk. The weight is the percentage of respondents for each criterion. To demonstrate the applicability of the method and discuss variations in the results, I have considered w*s = 3 min, 5 min, or 10 min and weight gS,z presented in Table 3-6. As a result, nine conditions are presented.
The conditions are indicated by the letter S followed by 2 digit numbers; the first digit indicates the scenario and the second one the variation in the willingness to walk. In each scenario, I have focused on the pillars of this dissertation. I have used QGIS software to illustrate the location of the selected flex zones in the scenarios. The scenarios are:
- Scenario 1 (S1) focuses on reduced disturbance in urban space, using existent infrastructure and less disturbance in the traffic; thus, higher weight factors are attributed to criteria 1 and 2.
- Scenario 2 (S2) focuses on the user, enhancing comfort and safety, and considering the cost of these benefits for operators and users. Hence, criteria 3 and 4 (i.e., safety/comfort and cost) received higher weight factors.
- Scenario 3 (S3) aims to benefit the operators and the service, choosing options for PUDO with the least cost and traffic disturbances.
Table 3-6 – Weight gS, z of criteria z in scenario S.

D2 – Identifying POIs location and their parking demand
The location and type of POIs were identified through OpenStreetMap and Google Maps, and the peak time of each POI was via Google popular times data. The parking demand (dj) according to POI type was based on previous studies [140], [141], [142], [143], [144], [145].
D3 – Calculating the required capacity of flex zones with PUDO priority for POI
I have calculated the required capacity of flex zones for each POI type n*j using Eq. 1; the results are shown in Table 3-7. If data are available to each single POI, then the categories are eliminated.
Table 3-7 – Required capacity of PUDO flex zones for each POI type.

L1 – Ranking of location types for flex zones with PUDO priority
I have proposed the following criteria based on issues pointed out in [16], [18], [128]:
- urban space disturbance,
- traffic flow disturbance,
- user safety and comfort, and
- operator costs.
I have identified 3 location types for flex zones with PUDO priority, so I have used a scale from 1 to 3 for the assessment value. I have assessed private parking as the most beneficial (i.e., 3 from scale) for criteria urban space and traffic flow disturbance because it offers the lowest interference on both criteria. However, private parking has the highest cost for operators due to higher parking fees and opening hours. Hence, I have assessed it as number 1 from the scale in the criterion cost. The proposed assessment values are presented in Table 3-8. Table 3-9 shows the evaluation values (efi) for the scenarios. The highest value means ranking as the first-best location type and is indicated in bold.
Table 3-8 – Assessment value of location types (afi,z)

Table 3-9 – Evaluation values of location types for scenarios.

L2 – Required capacity of flex zones with PUDO priority in the coverage areas
In this study, due to simplification, morning (6 a.m. to 12 p.m.), afternoon (12 p.m. to 6 p.m.), and night (6 p.m. to 12 a.m.) were defined as time intervals for the coverage areas. Besides that, the application of the method is shown only for S1 due to page limitation.
Considering S1 and its first-best location type (i.e. private parking), the coverage area for 3-min willingness to walk was drawn and the required capacity of flex zones at the peak time intervals was calculated. Table 3-10 presents the required capacity of flex zones for the coverage areas of PP1 to PP5. Four small shops (n*j = 10) with the same peak time interval are within PP1’s coverage area; thus, m*j = 40.
Table 3-10 – Required capacity of flex zones within a 3-min walking radius.

L3 – Flex zone selection for PUDO priority
Considering S1, its first-best location type, and 3-min willingness to walk, I have selected randomly PP1. Its coverage area contains POIs and PP1 is a multiple flex zone with ni = 200 available flex zones. Therefore, PP1 has more flex zones than the required number. As a result, m*j = 40 flex zones are selected, and ni – m*j = 160 flex zones are rejected. The process is repeated for the remaining flex zones with private parking types; PP2 to PP5.
The required capacity of flex zones in the coverage area of PP3 was unfulfilled, hence, the respective POI was considered in the next iterations. Its location was within the coverage area of PP5 and the remaining required capacity of flex zones was considered (37 PUDO flex zones). Thus, the required capacity of flex zones in PP5’s coverage area increased. Table 3-11 shows the number of selected flex zones for each private parking (first-best location type).
Table 3-11 – Capacity of selected PUDO flex zones.

Although 130 flex zones were selected for PP5, the required capacity of flex zones for the previous POI was still unfulfilled (12 PUDO flex zones). As all potential flex zones with the first-best location type were evaluated, I have continued the evaluation for potential flex zones on road lanes, and on curbside.
I have calculated the results for all the conditions (Table 3-12). Figure 3-5 illustrates the capacity and location of flex zones with PUDO priority for S11.
Table 3-12 – Results of flex zones with PUDO priority.
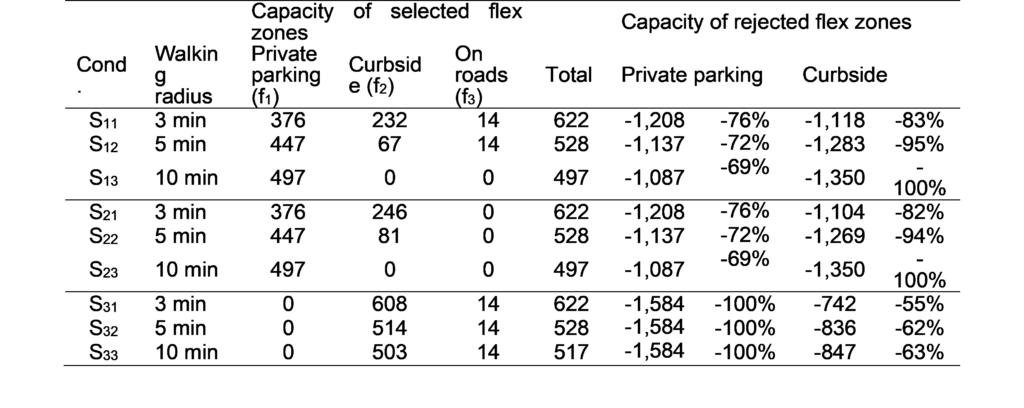
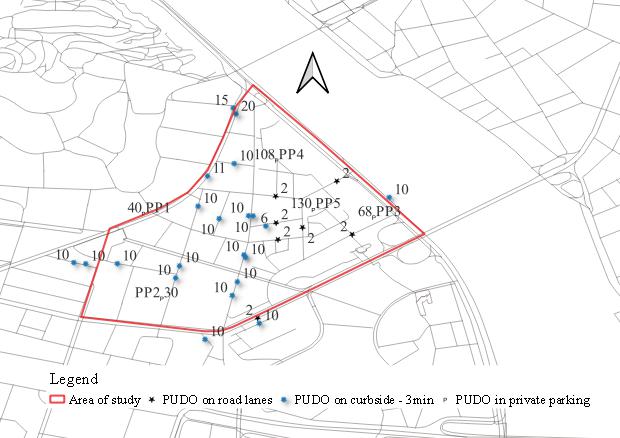
Figure 3-5 – Location and capacity of flex zones with PUDO priority for S11.
With the application of the method, the answer to the question “How many flex zones with which capacity are necessary and where to deploy them to serve the future parking demand?” for S1 scenarios:
- With 3-min walking radius, 376 flex zones in private parking, 232 flex zones on curbside parking, and 14 flex zones on roads.
- With 5-min walking radius, 447 flex zones in private parking, 67 flex zones on curbside parking, and 14 flex zones on roads.
- With 10-min walking radius, 497 flex zones in private parking.
The rejected flex zones serve other parking demands. If flex zones with PUDO priority on private parking are prioritized, more curbside parking lots are rejected and, consequently, they serve other parking demands or are repurposed.
As the walking radius increases, the possibility of coverage areas without any POI decreases and more flex zones with PUDO priority are selected. For example, 376 flex zones located in private parking are necessary in S11, while 447 PUDO flex zones in S12.
In S11, 83% of curbside parking lots will serve other parking demands or be repurposed. Moreover, by increasing the walking radius from 3 to 5 minutes, the total number of flex zones on the curbside is reduced to around 71% (from 232 to 67). Finally, S13 presented the lowest impact on urban space; the existing 1,350 curbside parking lots could be repurposed because flex zones with PUDO priority on private parking fulfilled the required capacity of flex zones at the peak time interval.
Even though I have focused on the use in S2, the number of curbside parking lots that can be eliminated is significant, being 1% smaller than S1’s results.
In S3, although the reduction of costs for operators is prioritized over the disturbance of urban space, a minimum of 55% of curbside parking lots will serve other parking demands. Hence, the use of SAV and the implementation of flex zones with PUDO priority within a walking radius represent a significant benefit for optimizing urban space. My results are aligned with the existing literature; high vehicle occupancy (i.e., high pooling rate) reduces the number of vehicles and, as a result, the amount of space required for flex zones [146].
Business Model for Shared Autonomous Mobility Services
Figure 4-5 illustrates the 63 service characteristics incorporated into the proposed BM. The proposed BM contains the general service characteristics and it is a mix of amplification and diversification due to the merger of BMs and the offer of customized service. I have presented in the proposed BM only service characteristics that are kept or changed. I have explained the most relevant kept and changed service characteristics. The remaining service characteristics are explained in my publication [183].
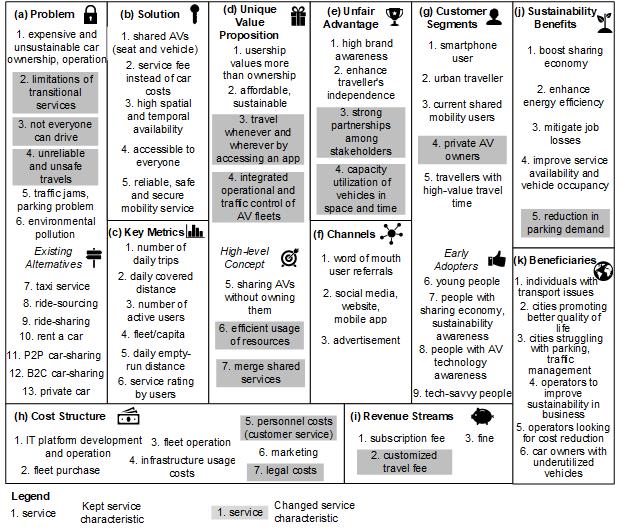
Figure 4-5 – Proposed BM for SAV services.
(a) Problem – Shared mobility services present temporal and spatial limitations /a2/:
- Taxi and ride-sourcing with pooling options are limited by the availability of the driver while the availability of the peer limits P2P service.
- Car rental has working hours.
- B2C service is restricted by service area, parking, and round-trip.
Customers who cannot drive (e.g.,) /a3/ are unable to use car-sharing and car rental. Travels are unsafe /a4/ due to the high number of car accidents.
(b) Solution – Compared to the current shared mobility services, the SAV service is accessible to everyone /b4/ and offers higher spatial and temporal availability /b3/ overcoming the current limitations /a2/. Both users and businesses benefit from high accessibility and service availability levels. Diverse services also boost competitiveness [173]. Furthermore, enhanced technology and communication will enhance traffic conditions, ensure predictability in travels, and foster a secure environment, thereby providing safety and reliability /b5/. Safety in AV-based services is the most important requirement regardless of age [184].
(c) Key Metrics – They are the same used for the current mobility services from /c1/ to /c6/ (Table H-1 Appendix – Comparison of Shared Mobility Services). The fleet size and fleet per capita are key indicators since different BMs can serve cities of different sizes [170]; hence, they will influence competitiveness.
Service providers monitor the daily empty-run distance /c5/ to assess its effects on operational costs and the environment (e.g., energy waste) caused by the high spatial availability. Focus on reducing environmental impacts is a compelling reason when negotiating reduction in taxes and free parking lots with local government. The service rating /c6/ demands service quality improvements indirectly.
(d) Unique Value Proposition – Travel whenever and wherever by accessing an app /d3/ is possible due to no spatial and temporal limitations. Efficient use of a resource is achieved /d6/ as the same vehicle is used more. The shared services are merged /d7/ into the SAV service. AVs communicate with each other [185], [186] and the mobility management center, guaranteeing integrated operational and traffic control of AV fleets /d4/. Even though the service is predictable and reliable which may enhance the willingness to use the service and profitability [187], the waiting time may increase due to pooling [188].
(e) Unfair advantage – Strong partnerships /e3/ among stakeholders imply a competitive advantage in the mobility market as the development of an AV fleet may be cost-prohibitive [172], [189]; small fleets might rise profitability by achieving high turnover and affordable operational assets [187]. Fewer vehicles are enough to supply the same demand if barriers to pooling are overcome [102], [103]. The capacity utilization of vehicles in space and time /e4/ decreases empty traveled kilometers while meeting the demand through the pooling option [187].
(f) Channels – Significant changes in communicating with possible customers are not expected [190], thus, current channels /f1/, /f2/, and /f3/ remain. However, companies may increase usage of the internet- and app-based channels. Therefore, focus on user experience and accessibility will be vital for the service’s usability.
(g) Customer Segments – A new customer segment is the private AV owners /g4/ who earn money making their vehicles available for public use. Expanding customer segments may enhance usability and market share. On the other hand, managing and customizing diverse customer segments need operational adjustments in departments such as marketing, customer experience, and finance.
(h) Cost Structure – Costs with platform development and operation /h1/ remain and an increase in costs generated by the development of an info-communication system and its operation is foreseen. Intensive cooperation between operational and traffic control centers is required, demanding more complex operational functions. Alternatively, costs with personnel for customer service /h5/, marketing /h6/, cleaning, and maintenance can be reduced through automation [191] and brand awareness. A rise in legal costs /h7/ is expected to comply with regulations and establish fruitful partnerships.
(i) Revenue Streams – Current shared mobility service companies already diversify service fees, and the proposed BM will be used by all shared mobility service companies resulting in very similar services. To overcome competitiveness, a new pricing strategy with different service types is available to attract users. Besides subscription fee /i1/ and fines /i3/, the customized travel fee /i2/ is applied which is a combination of service options:
- Spatial flexibility – total walking distance (access/egress distances), waiting (dedicated stop point).
- Temporal flexibility – service time, conditions of pre-ordering, reliability (delays, service disruptions, etc.), and waiting option as subsequent travels by the same vehicle can be a choice.
- Ride-sharing option – sharing the ride with unknown people, selection of travel.
- Performance-related usage fee – time- and/or distance-based fee, tolerated detour distance/time.
- Vehicle type.
- Special care – accompanying person, notifications to responsible people about the status of the journey, child seat, onboard catering.
- Advertisement and/or onboard infotainment – providing audio and visual content.
Service packages can be created according to the frequency of use and trip length [172], easing user’s decision-making and information about costs in advance. Additionally, expanding the service may increase revenues (e.g., providing on-demand services via a MaaS [192]).
(j) Sustainability Benefits – Energy efficiency is enhanced /j2/ with shorter headways and smoother acceleration [193]. AV adoption will generate considerable job losses (e.g., drivers) /j3/ leading to a substantial social cost burden [191], mainly for People of Color, increasing inequity [194]. Hence, offering special care with an accompanying person might mitigate this burden. A smoother transition to AV use is advised to allow displaced workers sufficient time to acquire new skills and get alternative employment opportunities [195].
The partnerships with private AV owners can boost advantages brought by the use of SAVs such as a reduction in parking demand /j5/ [53]. Considering that private AVs park themselves in a private garage, the use of private AVs in a SAV service will not increase parking demand; thus, pollutants from the construction of new parking lots will not be generated [196]. For this reason, companies may attract new customers or increase the number of loyal customers highlighting sustainability through marketing.
Environmental benefits are at risk depending on the use of AV-based services. Travelers being productive during the trips motivates people to use the service. Moreover, more accessible and convenient AV services lead to urban sprawl [197]; as a result, the vehicle kilometers traveled increases due to additional and longer trips, increasing emissions, noise and air pollution. To avoid the shift from public transport to AV services and encourage sharing, regulatory actions are a determinant factor of public behavior [198]. In this way, SAV integration into MaaS is a good strategy to achieve long-term positive environmental impacts.
(k) Beneficiaries – Shared mobility services with pooling should be encouraged in cities aiming to enhance the quality of life /k2/ and facing challenges with parking and traffic management /k3/. SAV can serve 30 person-trips per day and 13% of vehicle miles traveled are reduced when the pooling option is used [199].
People with disabilities, the elderly, and low-income groups will be the greatest beneficiaries of SAV services when policies determine transportation accessibility and social inclusion [194]. With affordable services, no need to own a vehicle, and relying on integration into multimodal public transport, beneficiaries will have more equitable access to jobs and services [200].
To address the question “How to alter the current BMs?”, I suggest that current shared mobility services companies:
- Neglect the service characteristics related to drivers – they are presented in key metrics, customer segments, cost and revenue blocks.
- Neglect non-smartphone users as a customer segment as users should prepare for the new technological era.
- Substitute the key metrics number of peers and number of days for rent by fleet per capita and number of daily trips in the SAV service, respectively.
- Establish strong partnerships with private AV owners and high-capacity utilization of vehicles, thus, sustainability benefits are achieved.
- Seek knowledge about integrated traffic control and legal requirements for the service as AV technology is developing, so companies are prepared in advance for IT development and additional costs.
- Do not create spatial and temporal limitations as AV technology brings this value proposition.
- Implement a customized travel fee that substitutes the service fee and additional service fee applied in the current shared mobility services.
Moreover, I propose that:
- Taxi companies implement technology to share trip costs and customized services as well as examine the new early adopters and customer segments to increase market share.
- Ride-sourcing, ride-sharing, and P2P car-sharing companies must investigate the cost-benefit of purchasing an AV fleet because the number of private AVs may not be enough to supply the demand and reach a profitable service.
- Car rental and B2C car-sharing companies must be aware of personnel costs with vehicle reallocation that may be substituted by costs with daily empty-run distance.
My results supplement existing literature and anticipate the changes in BM of current shared mobility service companies once AVs are implemented into the service. My recommendations support companies in preparing strategic action plans.
Before-After Comparison Method – Steps
The before-after comparison method is divided into 4 steps (Figure 5-4).
Figure 5-4 – Before-after comparison method.
The limitations are:
- Revenue model equations are shown only for individual stakeholders service model configuration.
- Revenue model equations for infrastructure operators focus on the urban space transformation generated by parking and PUDO activities.
Step 1: Evaluate the stakeholder’s capabilities
The inputs for this step are the content from the summary table Table 5-6. Business managers perform the following tasks:
- From the column “For what is paid?”, select the sources of revenue present in the service.
- For each selected source of revenue, double-check the indicated stakeholder in column “Who gets the revenue?”. If the indicated stakeholder is different from the stakeholder performing the tasks, it reveals aggregated capabilities. For example, if a mobility service provider also operates vehicles, the sources of revenue concerning the mobility service provider and vehicle operator are all part of the mobility service provider’s capabilities.
- Investigate if more sources of revenue exist in the service and extend the table filling out all columns.
- Identify the number of sources of revenue (output of the evaluation) determining the stakeholder’s capabilities of offering the SAV mobility service.
Table 5-6 – Results of applying the revenue model framework.

Step 2: Calculate the revenue before integration
After identifying the sources of revenue (inputs), choose the service model configuration before integration: individual stakeholders or merger of stakeholders.
Identify the types of RM assigned to the sources of revenue in Table 5-6.
For individual stakeholders, calculate the revenue before integration using the following equations.
For mobility service provider, calculate the revenue before integration R1 using Eq. (22). The revenue comes from subscriptions R1s of mobility service packages and pay-per-use of the service R1p. Also, from the commission of fines R1k, from the advertisement in the app R1a, and from data resell of trip and traveler information R1d.

For vehicle operator, calculate the revenue before integration R’1 using Eq. (26). The revenue comes from pay-per-use of the vehicle R’1p by mobility service provider, a commission from operation and infotainment R’1k, vehicle advertisement R’1a, and from reselling data from private AV owners R’1d.

For infrastructure operator, calculate the revenue considering the duration and fee for PUDOs by SAVs; PUDOs occur in parking lots previously used for parking of conventional vehicles. The trip demand for SAVs is proportional to the modal shares. The revenue is generated by the PUDO sessions of SAVs (Eq.(27)); when PUDO session fee for SAVs is per minute, use Eq.(28).

Charging per use of the infrastructure for PUDO sessions (Eq.(27)) is applied to SAV mobility services before and after integration into MaaS; therefore, the PUDO session fee is applied to door-to-door and feeder services. On the other hand, the PUDO fee per minute is applied to only door-to-door services, allowing the user to define how long the PUDO will last in a customized service.
The number of PUDO sessions is calculated depending on the pooling rate (Eq. (29)) and trip demand for SAVs. The total trip demand is constant.

For merger of stakeholders, extended or shortened capabilities, adapt these equations including or excluding the revenue sources. When merging stakeholders such as a mobility service provider that also operates vehicles, consider the following slight changes in sources of revenue into the adapted equations:
- All sources of revenue indicated to vehicle operators are transferred to mobility service providers except “per use of the vehicle”.
- “Per use of the vehicle” is excluded from the list of sources of revenue and incorporated into the fee of the “mobility service package”.
There are no changes in the types of RMs applied by mobility service providers; a) to e) RMs continue to be applied.
Step 3: Identify the alterations in the sources of revenue after integration into MaaS
Once the business is planning to integrate the service into MaaS, business managers choose the service model configuration after integration into MaaS (input). Levels 1 to 3 with individual stakeholders are shown in Figure 5-5. The variations in the service model configuration of level 3 – level 3i) and level 3ii) – are shown in Figure 5-6.
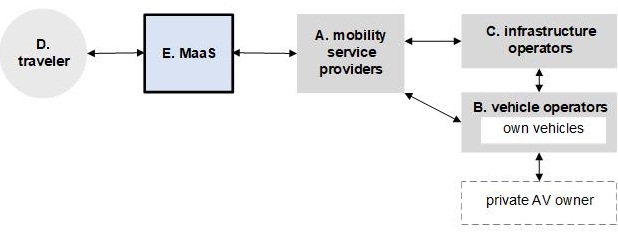
Figure 5-5 – MaaS acts as a bridge between travelers and service providers.
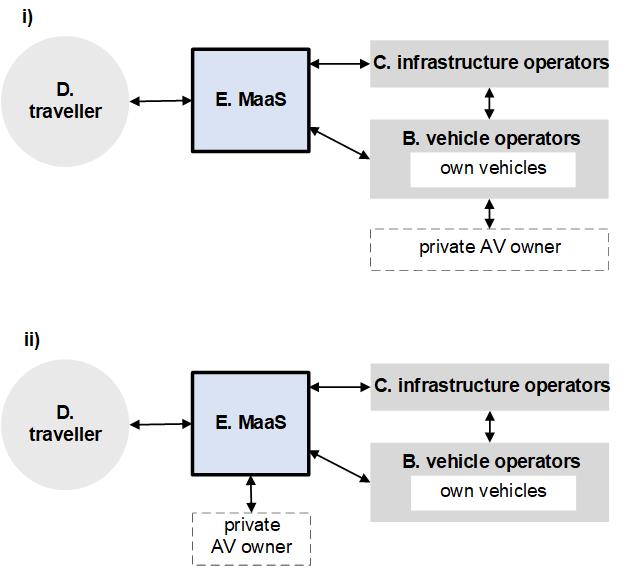
Figure 5-6 – Service model configurations with development of MaaS’ capabilities.
In the comparison table Table 5-7, business managers use the chosen service model configuration to identify the alterations in the sources of revenue, mainly the losses (output) for individual stakeholders. For instance, the mobility service provider loses the revenue from advertisement in the app from level 2.
Table 5-7 – Comparison of revenue models in before and after conditions.

In the merger of stakeholders, when mobility service provider also operates vehicles, the same alterations for individual stakeholders apply. MaaS takes over sources of revenue from mobility service provider, and in levels 3i) and 3ii), the mobility service provider only has sources of revenue related to the vehicle operator role.
Step 4: Compare the revenue before and after integration into MaaS
Business managers use the inequations (Ineq. (30), Ineq. (33), and Ineq. (34)) to compare the revenue before and after integration. The inequations were created based on the alterations in the sources of revenue and the revenue model equations after integration (inputs). If the results of applying the inequations output that the revenue after integration is higher than before integration, business managers conclude that integrating the business into MaaS is beneficial to the business from the perspective of revenue.
For mobility service providers, use Ineq. (30) in the comparison. The integration of SAV mobility services into MaaS is beneficial to the business if the revenue generated by the increase in the number of trips outweighs the loss of revenue and new costs arising from the integration in level 3. The revenue comes from subscriptions R2s and pay-per-use R2p mobility service packages. The losses in revenue are from advertisement R1a, data resell R1d and commission R1k. The commission paid to the MaaS provider C for booking and ticketing as well as handling the fines are new costs.

For vehicle operators, use Ineq. (33) in the comparison. The integration of SAV mobility services into MaaS will be beneficial to the business in Level 3 ii) if the revenue from pay-per-use of the vehicle paid by MaaS, commission from infotainment and advertisement by other companies outweighs the revenue before integration and the commission paid to MaaS to forward AV owners.

For infrastructure operators, there are no changes in the sources of revenue and RMs. The integration is beneficial to the business if more per use of the infrastructure arises (Ineq. (34)).

Bibliography
[1] ‘Definition of Autonomous Vehicles – Gartner Information Technology Glossary’, Gartner. Accessed: Aug. 20, 2023. [Online]. Available: https://www.gartner.com/en/information-technology/glossary/autonomous-vehicles
[2] M. Peric, J. Durkin, and V. Vitezic, ‘The Constructs of a Business Model Redefined: A Half-Century Journey’, Sage Open, vol. 7, no. 3, Sep. 2017, doi: 10.1177/2158244017733516.
[3] G. A. Ahmady, M. Mehrpour, and A. Nikooravesh, ‘Organizational Structure’, Procedia – Social and Behavioral Sciences, vol. 230, pp. 455–462, Sep. 2016, doi: 10.1016/j.sbspro.2016.09.057.
[4] E. H. Schein, ‘Organizational culture’, American Psychologist, vol. 45, no. 2, pp. 109–119, 1990, doi: 10.1037/0003-066X.45.2.109.
[5] Ron Meyer, ‘Model 4: Revenue Model Framework – Center for Strategy & Leadership’. Accessed: Mar. 21, 2022. [Online]. Available: https://www.c4sl.eu/portfolio/revenue-model-framework/
[6] ‘Going Small – The Transition to Urban Micromobility’, WSP. Accessed: Oct. 21, 2023. [Online]. Available: https://www.wsp.com/en-ca/insights/going-small-the-transition-to-urban-micromobility
[7] A. Ungvarai, ‘Modal Split – Different Approaches to a Common Term’, IOP Conf. Ser.: Mater. Sci. Eng., vol. 603, no. 4, p. 042091, Sep. 2019, doi: 10.1088/1757-899X/603/4/042091.
[8] S. Davis, M. Mitman, K. Stangl, and D. Wasserman, ‘Curbside Inventory Report’, Institute of Transportation Engineers, Washington, DC, FHWA-HEP-21-028, Jul. 2021.
[9] ‘Before-and-after study: comparative studies’, GOV.UK. Accessed: Oct. 05, 2024. [Online]. Available: https://www.gov.uk/guidance/before-and-after-study-comparative-studies
[10] S. Sardesai, M. Stute, and J. Kamphues, ‘A Methodology for Future Scenario Planning’, in Next Generation Supply Chains: A Roadmap for Research and Innovation, R. Fornasiero, S. Sardesai, A. C. Barros, and A. Matopoulos, Eds., Cham: Springer International Publishing, 2021, pp. 35–59. doi: 10.1007/978-3-030-63505-3_2.
[11] S. Mannucci, J. H. Kwakkel, M. Morganti, and M. Ferrero, ‘Exploring potential futures: Evaluating the influence of deep uncertainties in urban planning through scenario planning: A case study in Rome, Italy’, Futures, vol. 154, p. 103265, Dec. 2023, doi: 10.1016/j.futures.2023.103265.
[12] K. Heineke, B. Kloss, A. Mertens-von Rüden, T. Möller, and C. Wiemuth, ‘Shared mobility: Sustainable cities, shared destinies | McKinsey’, McKinsey & Company. Accessed: Oct. 12, 2024. [Online]. Available: https://www.mckinsey.com/industries/automotive-and-assembly/our-insights/shared-mobility-sustainable-cities-shared-destinies#/
[13] M. Timo, P. Asutosh, P. Dickon, and T. Andreas, ‘The future of mobility is at our doorstep’, McKinsey&Company. Accessed: Aug. 13, 2021. [Online]. Available: https://www.mckinsey.com/industries/automotive-and-assembly/our-insights/the-future-of-mobility-is-at-our-doorstep
[14] ‘32 shared mobility stats from 2023 you should know in 2024’, ATOM mobility. Accessed: Oct. 12, 2024. [Online]. Available: https://www.atommobility.com/blog/32-shared-mobility-stats-from-2023-you-should-know-in-2024
[15] M. Lagadic, A. Verloes, and N. Louvet, ‘Can carsharing services be profitable? A critical review of established and developing business models’, Transport Policy, vol. 77, pp. 68–78, May 2019, doi: 10.1016/j.tranpol.2019.02.006.
[16] J. Rosenblum, A. W. Hudson, and E. Ben-Joseph, ‘Parking futures: An international review of trends and speculation’, Land Use Policy, vol. 91, no. 104054, Feb. 2020, doi: 10.1016/j.landusepol.2019.104054.
[17] A. Stocker and S. Shaheen, ‘Shared automated vehicles: Review of BMs’. International Transport Forum, 2017. Accessed: Aug. 13, 2021. [Online]. Available: https://www.itf-oecd.org/sites/default/files/docs/shared-automated-vehicles-business-models.pdf
[18] D. Stead and B. Vaddadi, ‘Automated vehicles and how they may affect urban form: A review of recent scenario studies’, Cities, vol. 92, pp. 125–133, Sep. 2019, doi: 10.1016/j.cities.2019.03.020.
[19] Q. Ma, K. Kockelman, and M. Segal, ‘Making the Most of Curb Spaces in a World of Shared Autonomous Vehicles: A Case Study of Austin, Texas’, presented at the Transportation Research Board 97th Annual MeetingTransportation Research Board, 2018. Accessed: Oct. 10, 2024. [Online]. Available: https://trid.trb.org/View/1494816
[20] D. Kondor, P. Santi, D.-T. Le, X. Zhang, A. Millard-Ball, and C. Ratti, ‘Addressing the “minimum parking” problem for on-demand mobility’, Feb. 20, 2020, arXiv: arXiv:1808.05935. Accessed: Oct. 12, 2024. [Online]. Available: http://arxiv.org/abs/1808.05935
[21] D. Heinrichs, ‘Autonomous Driving and Urban Land Use’, in Autonomous Driving: Technical, Legal and Social Aspects, M. Maurer, J. C. Gerdes, B. Lenz, and H. Winner, Eds., Berlin, Heidelberg: Springer, 2016, pp. 213–231. doi: 10.1007/978-3-662-48847-8_11.
[22] T. Yigitcanlar, M. Wilson, and M. Kamruzzaman, ‘Disruptive Impacts of Automated Driving Systems on the Built Environment and Land Use: An Urban Planner’s Perspective’, Journal of Open Innovation: Technology, Market, and Complexity, vol. 5, no. 2, p. 24, Jun. 2019, doi: 10.3390/joitmc5020024.
[23] Földes D., ‘Innovatív közlekedési rendszerek és szolgáltatások fejlesztése’, 2019. Accessed: Oct. 12, 2024. [Online]. Available: http://hdl.handle.net/10890/13129
[24] A. Zarkeshev, ‘Information management models and methods for innovative transportation systems and services’, 2020. Accessed: Oct. 12, 2024. [Online]. Available: http://hdl.handle.net/10890/15070
[25] Y. He, ‘Analysis methods and models facilitating mobility as a service based on autonomous vehicles’, 2022. Accessed: Oct. 12, 2024. [Online]. Available: http://hdl.handle.net/10890/16990
[26] J. Wang, H. Huang, K. Li, and J. Li, ‘Towards the Unified Principles for Level 5 Autonomous Vehicles’, Engineering, vol. 7, no. 9, pp. 1313–1325, Sep. 2021, doi: 10.1016/j.eng.2020.10.018.
[27] ‘Descriptive vs Analytical Research’, Gulf University for Science & Tehcnology. Accessed: Oct. 12, 2024. [Online]. Available: https://www.gust.edu.kw/descriptive-vs-analytical-rg
[28] S. Kisilevich, F. Mansmann, M. Nanni, and S. Rinzivillo, ‘Spatio-temporal clustering’, in Data Mining and Knowledge Discovery Handbook, O. Maimon and L. Rokach, Eds., Boston, MA: Springer US, 2010, pp. 855–874. doi: 10.1007/978-0-387-09823-4_44.
[29] Z. Dong and C. Guo, ‘A Literature Review of Spatio-temporal Data Analysis’, J. Phys.: Conf. Ser., vol. 1792, no. 1, p. 012056, Feb. 2021, doi: 10.1088/1742-6596/1792/1/012056.
[30] R. M. Groves, F. J. F. Jr, M. P. Couper, J. M. Lepkowski, E. Singer, and R. Tourangeau, Survey Methodology. John Wiley & Sons, 2009.
[31] ‘Discrete Choice Model and Analysis | Columbia Public Health’, Columbia University Mailman School of Public Health. Accessed: Oct. 12, 2024. [Online]. Available: https://www.publichealth.columbia.edu/research/population-health-methods/discrete-choice-model-and-analysis
[32] M. Bierlaire, ‘Discrete Choice Models’, in Operations Research and Decision Aid Methodologies in Traffic and Transportation Management, M. Labbé, G. Laporte, K. Tanczos, and P. Toint, Eds., Berlin, Heidelberg: Springer, 1998, pp. 203–227. doi: 10.1007/978-3-662-03514-6_9.
[33] H. Nautiyal and V. Goel, ‘Chapter 3 – Sustainability assessment: Metrics and methods’, in Methods in Sustainability Science, J. Ren, Ed., Elsevier, 2021, pp. 27–46. doi: 10.1016/B978-0-12-823987-2.00017-9.
[34] Richard L. Church, ‘Location modeling and GIS’, in Geographical information systems, edited by P.A. Longley, M.F. Goodchild, D.J. Maguire, D.W. Rhind, 2nd ed., vol. 1, Principles and Technical Issues, USA: John Wiley & Sons, Inc., 1999, pp. 293–303. Accessed: Feb. 10, 2022. [Online]. Available: https://www.geos.ed.ac.uk/~gisteac/gis_book_abridged/files/ch20.pdf
[35] B. Liu, ‘Facility Location Problem’, in Theory and Practice of Uncertain Programming, B. Liu, Ed., Berlin, Heidelberg: Springer, 2009, pp. 157–165. doi: 10.1007/978-3-540-89484-1_11.
[36] M. de O. Lage, C. A. Soares Machado, C. M. Monteiro, F. T. Berssaneti, and J. A. Quintanilha, ‘Location Suitable for the Implementation of Carsharing in the City of São Paulo’, Procedia Manufacturing, vol. 39, pp. 1962–1967, 2019, doi: 10.1016/j.promfg.2020.01.235.
[37] J.-P. Rodrigue, ‘A.9 – Location-Allocation Models’, in The Geography of Transport Systems, Sixth., New York: Routledge, 2024. Accessed: Oct. 12, 2024. [Online]. Available: https://transportgeography.org/contents/methods/location-allocation-models/
[38] B. W. Wirtz, A. Pistoia, S. Ullrich, and V. Göttel, ‘Business Models: Origin, Development and Future Research Perspectives’, Long Range Planning, vol. 49, no. 1, pp. 36–54, Feb. 2016, doi: 10.1016/j.lrp.2015.04.001.
[39] A. Osterwalder and Y. Pigneur, ‘Business Model Generation: A handbook for visionaries, game changers and challengers’, undefined, 2010, Accessed: Sep. 01, 2021. [Online]. Available: https://www.semanticscholar.org/paper/Business-Model-Generation%3A-A-handbook-for-game-and-Osterwalder-Pigneur/f9af326fc7bb8b25b62ad5e7e6dfc92079f33edc
[40] M. S. Thiese, ‘Observational and interventional study design types; an overview’, Biochem Med (Zagreb), vol. 24, no. 2, pp. 199–210, Jun. 2014, doi: 10.11613/BM.2014.022.
[41] C. Csiszár, B. Csonka, and D. Földes, Innovative Passenger Transportation Systems. 2019. Accessed: Apr. 06, 2024. [Online]. Available: https://mersz.hu/csiszar-csonka-foldes-innovative-passenger-transportation-systems
[42] L. De Paepe and F. Witlox, ‘Social acceptability of shared autonomous vehicles. From avoiders to innovators in Hannover (Germany)’, Research in Transportation Business & Management, vol. 57, p. 101195, Dec. 2024, doi: 10.1016/j.rtbm.2024.101195.
[43] C. J. Haboucha, R. Ishaq, and Y. Shiftan, ‘User preferences regarding autonomous vehicles’, Transportation Research Part C: Emerging Technologies, vol. 78, pp. 37–49, May 2017, doi: 10.1016/j.trc.2017.01.010.
[44] N. Barbour, N. Menon, Y. Zhang, and F. Mannering, ‘Shared automated vehicles: A statistical analysis of consumer use likelihoods and concerns’, Transport Policy, vol. 80, pp. 86–93, Aug. 2019, doi: 10.1016/j.tranpol.2019.05.013.
[45] P. Bansal, K. M. Kockelman, and A. Singh, ‘Assessing public opinions of and interest in new vehicle technologies: An Austin perspective’, Transportation Research Part C: Emerging Technologies, vol. 67, pp. 1–14, Jun. 2016, doi: 10.1016/j.trc.2016.01.019.
[46] W. Zhang, S. Guhathakurta, J. Fang, and G. Zhang, ‘Exploring the impact of shared autonomous vehicles on urban parking demand: An agent-based simulation approach’, Sustainable Cities and Society, vol. 19, pp. 34–45, Dec. 2015, doi: 10.1016/j.scs.2015.07.006.
[47] H. Dia and F. Javanshour, ‘Autonomous Shared Mobility-On-Demand: Melbourne Pilot Simulation Study’, Transportation Research Procedia, vol. 22, pp. 285–296, Jan. 2017, doi: 10.1016/j.trpro.2017.03.035.
[48] M. Hao and T. Yamamoto, ‘Analysis on supply and demand of shared autonomous vehicles considering household vehicle ownership and shared use’, in 2017 IEEE 20th International Conference on Intelligent Transportation Systems (ITSC), Oct. 2017, pp. 185–190. doi: 10.1109/ITSC.2017.8317920.
[49] W. Zhang, S. Guhathakurta, and E. B. Khalil, ‘The impact of private autonomous vehicles on vehicle ownership and unoccupied VMT generation’, Transportation Research Part C: Emerging Technologies, vol. 90, pp. 156–165, May 2018, doi: 10.1016/j.trc.2018.03.005.
[50] C. Llorca, A. Moreno, and R. Moeckel, ‘Effects of Shared Autonomous Vehicles on the Level of Service in the Greater Munich Metropolitan Area’, Transportation Research Procedia, p. 9, 2016.
[51] ‘Reshaping Urban Mobility with Autonomous Vehicles – Lessons from the City of Boston’, World Economic Forum, Geneva, Switzerland, Jun. 2018. Accessed: Jul. 31, 2021. [Online]. Available: http://www3.weforum.org/docs/WEF_Reshaping_Urban_Mobility_with_Autonomous_Vehicles_2018.pdf
[52] ‘Urban Mobility System Upgrade – How shared self-driving cars could change city traffic’, International Transport Forum, Paris, France, Corporate Partnership Board Report, 2015. Accessed: Jul. 31, 2021. [Online]. Available: https://www.itf-oecd.org/sites/default/files/docs/15cpb_self-drivingcars.pdf
[53] W. Zhang and S. Guhathakurta, ‘Parking Spaces in the Age of Shared Autonomous Vehicles: How Much Parking Will We Need and Where?’, Transportation Research Record, vol. 2651, no. 1, pp. 80–91, Jan. 2017, doi: 10.3141/2651-09.
[54] S. Gössling, M. Schröder, P. Späth, and T. Freytag, ‘Urban Space Distribution and Sustainable Transport’, Transport Reviews, vol. 36, no. 5, pp. 659–679, Sep. 2016, doi: 10.1080/01441647.2016.1147101.
[55] C. De Gruyter, S. M. Zahraee, and W. Young, ‘Understanding the allocation and use of street space in areas of high people activity’, Journal of Transport Geography, vol. 101, p. 103339, May 2022, doi: 10.1016/j.jtrangeo.2022.103339.
[56] M. Attard, L. A. Guzman, and D. Oviedo, ‘Urban space distribution: The case for a more equitable mobility system’, Case Studies on Transport Policy, vol. 14, p. 101096, Dec. 2023, doi: 10.1016/j.cstp.2023.101096.
[57] L. Gebhardt, C. Wolf, and R. Seiffert, ‘“I’ll Take the E-Scooter Instead of My Car”—The Potential of E-Scooters as a Substitute for Car Trips in Germany’, Sustainability, vol. 13, no. 13, Art. no. 13, Jan. 2021, doi: 10.3390/su13137361.
[58] M. Strömgren, P. Schantz, J. N. Sommar, W. Raza, A. Markstedt, and B. Forsberg, ‘Modeling commuter modal shift from car trips to cycling: Scenario construction and outcomes for Stockholm, Sweden’, Journal of Transport Geography, vol. 86, p. 102740, Jun. 2020, doi: 10.1016/j.jtrangeo.2020.102740.
[59] S. Mingzhu, Y. Zhang, Z. Shen, M. Li, and Z. Dong, ‘Mode Shift from Car to Bike Shared: A Travel-Mode Choice Model’, Jul. 2019, p. 2410. doi: 10.1061/9780784482292.209.
[60] D. Fuller, L. Gauvin, Y. Kestens, P. Morency, and L. Drouin, ‘The potential modal shift and health benefits of implementing a public bicycle share program in Montreal, Canada’, Int J Behav Nutr Phys Act, vol. 10, no. 1, p. 66, May 2013, doi: 10.1186/1479-5868-10-66.
[61] J. de Kruijf, D. Ettema, C. B. M. Kamphuis, and M. Dijst, ‘Evaluation of an incentive program to stimulate the shift from car commuting to e-cycling in the Netherlands’, Journal of Transport & Health, vol. 10, pp. 74–83, Sep. 2018, doi: 10.1016/j.jth.2018.06.003.
[62] D. M. Dean, ‘Scenario Planning: A Literature Review’, London, UK., Nov. 27, 2019.
[63] W. Weimer-Jehle, ‘ScenarioWizard 4.54 Manual – Constructing consistent Scenarios Using Cross-Impact Balance Analysis’. University of Stuttgart, 2023. Accessed: Jul. 27, 2024. [Online]. Available: https://www.cross-impact.org/ressourcen/ScenarioWizardManual_en.pdf
[64] K. Cordova-Pozo and E. A. J. A. Rouwette, ‘Types of scenario planning and their effectiveness: A review of reviews’, Futures, vol. 149, p. 103153, May 2023, doi: 10.1016/j.futures.2023.103153.
[65] P. Jing, G. Xu, Y. Chen, Y. Shi, and F. Zhan, ‘The Determinants behind the Acceptance of Autonomous Vehicles: A Systematic Review’, Sustainability, vol. 12, no. 5, Art. no. 5, Jan. 2020, doi: 10.3390/su12051719.
[66] M. Greifenstein, ‘Factors influencing the user behaviour of shared autonomous vehicles (SAVs): A systematic literature review’, Transportation Research Part F: Traffic Psychology and Behaviour, vol. 100, pp. 323–345, Jan. 2024, doi: 10.1016/j.trf.2023.10.027.
[67] A. Shariff, J.-F. Bonnefon, and I. Rahwan, ‘Psychological roadblocks to the adoption of self-driving vehicles’, Nat Hum Behav, vol. 1, no. 10, pp. 694–696, Oct. 2017, doi: 10.1038/s41562-017-0202-6.
[68] B. Kahl, ‘Human Biases Preventing The Widespread Adoption Of Self-Driving Cars’, Apr. 02, 2021, arXiv: arXiv:2104.01022. doi: 10.48550/arXiv.2104.01022.
[69] S. Nordhoff, ‘Resistance towards autonomous vehicles (AVs)’, Transportation Research Interdisciplinary Perspectives, vol. 26, p. 101117, Jul. 2024, doi: 10.1016/j.trip.2024.101117.
[70] I. Ullah, J. Zheng, S. Ullah, K. Bhattarai, H. Almujibah, and H. Alawad, ‘Unraveling the Complex Barriers to and Policies for Shared Autonomous Vehicles: A Strategic Analysis for Sustainable Urban Mobility’, Systems, vol. 12, no. 12, Art. no. 12, Dec. 2024, doi: 10.3390/systems12120558.
[71] S. Koul and A. Eydgahi, ‘The Impact of Social Influence, Technophobia, and Perceived Safety on Autonomous Vehicle Technology Adoption’, Periodica Polytechnica Transportation Engineering, vol. 48, no. 2, Art. no. 2, 2020, doi: 10.3311/PPtr.11332.
[72] P. Liu, Y. Zhang, and Z. He, ‘The effect of population age on the acceptable safety of self-driving vehicles’, Reliability Engineering & System Safety, vol. 185, pp. 341–347, May 2019, doi: 10.1016/j.ress.2019.01.003.
[73] R. Krueger, T. H. Rashidi, and J. M. Rose, ‘Preferences for shared autonomous vehicles’, Transportation Research Part C: Emerging Technologies, vol. 69, pp. 343–355, Aug. 2016, doi: 10.1016/j.trc.2016.06.015.
[74] P. Bansal and K. M. Kockelman, ‘Forecasting Americans’ long-term adoption of connected and autonomous vehicle technologies’, Transportation Research Part A: Policy and Practice, vol. 95, pp. 49–63, Jan. 2017, doi: 10.1016/j.tra.2016.10.013.
[75] ‘Emerging Technologies – Autonomous Cars: Not if, but When’. IHS Automotive, 2014. [Online]. Available: https://autotechinsight.ihsmarkit.com/_assets/sampledownloads/auto-tech-report-emerging-tech-autonomous-car-2013-sample_1404310053.pdf
[76] ‘How self driving cars will lead to small, shared, electric vehicles that will save our cities and climate – ZEnMo simulations’. Accessed: Nov. 01, 2023. [Online]. Available: https://zenmo.com/how-self-driving-cars-will-lead-to-small-shared-electric-vehicles-that-will-save-our-cities-and-climate/
[77] S. Biswas, S. Chandra, and I. Ghosh, ‘Effects of On-Street Parking in Urban Context: A Critical Review’, Transp. in Dev. Econ., vol. 3, no. 1, p. 10, Apr. 2017, doi: 10.1007/s40890-017-0040-2.
[78] F. Ostermeijer, H. RA. Koster, and J. van Ommeren, ‘Residential parking costs and car ownership: Implications for parking policy and automated vehicles’, Regional Science and Urban Economics, vol. 77, pp. 276–288, Jul. 2019, doi: 10.1016/j.regsciurbeco.2019.05.005.
[79] S. A. Miller and B. R. Heard, ‘The Environmental Impact of Autonomous Vehicles Depends on Adoption Patterns’, Environ. Sci. Technol., vol. 50, no. 12, pp. 6119–6121, Jun. 2016, doi: 10.1021/acs.est.6b02490.
[80] C. Pakusch, G. Stevens, A. Boden, and P. Bossauer, ‘Unintended Effects of Autonomous Driving: A Study on Mobility Preferences in the Future’, Sustainability, vol. 10, no. 7, Art. no. 7, Jul. 2018, doi: 10.3390/su10072404.
[81] K. J. Herin and J. Akkara, ‘Study of “On-Street” and “Off-Street” Parking Choice Behaviour’, in Proceedings of the National Conference and Seminar on Innovations in Engineering & Technology, Kuala Lumpur, Malasya, Feb. 2019, pp. 79–84. Accessed: Nov. 26, 2023. [Online]. Available: https://ijarcce.com/wp-content/uploads/2019/03/PCON-14.pdf
[82] J. D. Hunt and S. Teply, ‘A nested logit model of parking location choice’, Transportation Research Part B: Methodological, vol. 27, no. 4, pp. 253–265, Aug. 1993, doi: 10.1016/0191-2615(93)90035-9.
[83] M. Hua, X. Chen, S. Zheng, L. Cheng, and J. Chen, ‘Estimating the parking demand of free-floating bike sharing: A journey-data-based study of Nanjing, China’, Journal of Cleaner Production, vol. 244, p. 118764, Jan. 2020, doi: 10.1016/j.jclepro.2019.118764.
[84] J. Xu, Z. Zhang, and J. Rong, ‘The Forecasting Model of Bicycle Parking Demand on Campus Teaching and Office District’, Procedia – Social and Behavioral Sciences, vol. 43, pp. 550–557, Jan. 2012, doi: 10.1016/j.sbspro.2012.04.128.
[85] D. Buck, R. Buehler, P. Happ, B. Rawls, P. Chung, and N. Borecki, ‘Are Bikeshare Users Different from Regular Cyclists?: A First Look at Short-Term Users, Annual Members, and Area Cyclists in the Washington, D.C., Region’, Transportation Research Record, vol. 2387, no. 1, pp. 112–119, Jan. 2013, doi: 10.3141/2387-13.
[86] X. Ma, Y. Yuan, N. Van Oort, and S. Hoogendoorn, ‘Bike-sharing systems’ impact on modal shift: A case study in Delft, the Netherlands’, Journal of Cleaner Production, vol. 259, p. 120846, Jun. 2020, doi: 10.1016/j.jclepro.2020.120846.
[87] R. L. Sanders, M. Branion-Calles, and T. A. Nelson, ‘To scoot or not to scoot: Findings from a recent survey about the benefits and barriers of using E-scooters for riders and non-riders’, Transportation Research Part A: Policy and Practice, vol. 139, pp. 217–227, Sep. 2020, doi: 10.1016/j.tra.2020.07.009.
[88] S. Tuncer, E. Laurier, B. Brown, and C. Licoppe, ‘Notes on the practices and appearances of e-scooter users in public space’, Journal of Transport Geography, vol. 85, p. 102702, May 2020, doi: 10.1016/j.jtrangeo.2020.102702.
[89] A. T. M. Oakil, D. Ettema, T. Arentze, and H. Timmermans, ‘Bicycle commuting in the Netherlands: An analysis of modal shift and its dependence on life cycle and mobility events’, International Journal of Sustainable Transportation, vol. 10, no. 4, pp. 376–384, Apr. 2016, doi: 10.1080/15568318.2014.905665.
[90] B. Laa and U. Leth, ‘Survey of E-scooter users in Vienna: Who they are and how they ride’, Journal of Transport Geography, vol. 89, p. 102874, Dec. 2020, doi: 10.1016/j.jtrangeo.2020.102874.
[91] A. Nikitas, ‘Understanding bike-sharing acceptability and expected usage patterns in the context of a small city novel to the concept: A story of “Greek Drama”’, Transportation Research Part F: Traffic Psychology and Behaviour, vol. 56, pp. 306–321, Jul. 2018, doi: 10.1016/j.trf.2018.04.022.
[92] Y.-H. Wu, L. Kang, Y.-T. Hsu, and P.-C. Wang, ‘Exploring trip characteristics of bike-sharing system uses: Effects of land-use patterns and pricing scheme change’, International Journal of Transportation Science and Technology, vol. 8, no. 3, pp. 318–331, Sep. 2019, doi: 10.1016/j.ijtst.2019.05.003.
[93] ‘Pick-up/Drop-off Pilot’, City of Boston, Boston, USA, Initial Assessment & Early Findings, 2020. Accessed: Sep. 01, 2022. [Online]. Available: https://www.boston.gov/sites/default/files/file/2019/12/PUDO%20report_v1206update.pdf
[94] D. Siqueira Silva, C. Csiszár, and D. Földes, ‘Autonomous vehicles and urban space management’, SJSUT.ST, vol. 110, pp. 169–181, Mar. 2021, doi: 10.20858/sjsutst.2021.110.14.
[95] H. Madureira, F. Nunes, J. V. Oliveira, and T. Madureira, ‘Preferences for Urban Green Space Characteristics: A Comparative Study in Three Portuguese Cities’, Environments, vol. 5, no. 2, Art. no. 2, Feb. 2018, doi: 10.3390/environments5020023.
[96] F. Fantozzi, F. Monaci, T. Blanusa, and R. Bargagli, ‘Spatio-temporal variations of ozone and nitrogen dioxide concentrations under urban trees and in a nearby open area’, Urban Climate, vol. 12, pp. 119–127, Jun. 2015, doi: 10.1016/j.uclim.2015.02.001.
[97] F. J. Escobedo and D. J. Nowak, ‘Spatial heterogeneity and air pollution removal by an urban forest’, Landscape and Urban Planning, vol. 90, no. 3, pp. 102–110, Apr. 2009, doi: 10.1016/j.landurbplan.2008.10.021.
[98] A. Graefe, K. C. Green, and J. S. Armstrong, ‘Forecasting’, in Encyclopedia of Operations Research and Management Science, S. I. Gass and M. C. Fu, Eds., Boston, MA: Springer US, 2013, pp. 593–604. doi: 10.1007/978-1-4419-1153-7_357.
[99] C. Louen, N. Höing, C. Böhnen, and T. Kuhnimhof, ‘Scenario planning as an approach to structure the development of transport planning alternatives’, Case Studies on Transport Policy, vol. 14, p. 101089, Dec. 2023, doi: 10.1016/j.cstp.2023.101089.
[100] K. Van Der Heijden, ‘Scenarios and Forecasting: Two Perspectives’, Technological Forecasting and Social Change, vol. 65, no. 1, pp. 31–36, Sep. 2000, doi: 10.1016/S0040-1625(99)00121-3.
[101] D. J. Koehler and N. Harvey, Blackwell Handbook of Judgment and Decision Making. John Wiley & Sons, 2008.
[102] P. S. Lavieri and C. R. Bhat, ‘Modeling individuals’ willingness to share trips with strangers in an autonomous vehicle future’, Transportation Research Part A: Policy and Practice, vol. 124, pp. 242–261, Jun. 2019, doi: 10.1016/j.tra.2019.03.009.
[103] T. Stoiber, I. Schubert, R. Hoerler, and P. Burger, ‘Will consumers prefer shared and pooled-use autonomous vehicles? A stated choice experiment with Swiss households’, Transportation Research Part D: Transport and Environment, vol. 71, pp. 265–282, Jun. 2019, doi: 10.1016/j.trd.2018.12.019.
[104] N. Adnan, S. Md Nordin, M. A. bin Bahruddin, and M. Ali, ‘How trust can drive forward the user acceptance to the technology? In-vehicle technology for autonomous vehicle’, Transportation Research Part A: Policy and Practice, vol. 118, pp. 819–836, Dec. 2018, doi: 10.1016/j.tra.2018.10.019.
[105] J. Xiao and K. G. Goulias, ‘Perceived usefulness and intentions to adopt autonomous vehicles’, Transportation Research Part A: Policy and Practice, vol. 161, pp. 170–185, Jul. 2022, doi: 10.1016/j.tra.2022.05.007.
[106] F. Manca, A. Sivakumar, and J. W. Polak, ‘The effect of social influence and social interactions on the adoption of a new technology: The use of bike sharing in a student population’, Transportation Research Part C: Emerging Technologies, vol. 105, pp. 611–625, Aug. 2019, doi: 10.1016/j.trc.2019.02.010.
[107] S. Pettigrew et al., ‘Public support for proposed government policies to optimise the social benefits of autonomous vehicles’, Transport Policy, vol. 149, pp. 264–270, Apr. 2024, doi: 10.1016/j.tranpol.2024.02.016.
[108] T. Fleming, S. Turner, and L. Tarjomi, ‘Reallocation of road space’, NZ Transport Agency, New Zealand, Research Report 530, 2013. [Online]. Available: https://www.nzta.govt.nz/assets/resources/research/reports/530/docs/RR-530-Reallocation-of-road-space.pdf
[109] D. Hopkins, E. García Bengoechea, and S. Mandic, ‘Adolescents and their aspirations for private car-based transport’, Transportation, vol. 48, no. 1, pp. 67–93, Feb. 2021, doi: 10.1007/s11116-019-10044-4.
[110] A. Simonofski, E. Hertoghe, M. Steegmans, M. Snoeck, and Y. Wautelet, ‘Engaging citizens in the smart city through participation platforms: A framework for public servants and developers’, Computers in Human Behavior, vol. 124, p. 106901, Nov. 2021, doi: 10.1016/j.chb.2021.106901.
[111] M. J. Nieuwenhuijsen, ‘New urban models for more sustainable, liveable and healthier cities post covid19; reducing air pollution, noise and heat island effects and increasing green space and physical activity’, Environment International, vol. 157, p. 106850, Dec. 2021, doi: 10.1016/j.envint.2021.106850.
[112] M. Nieuwenhuijsen et al., ‘The Superblock model: A review of an innovative urban model for sustainability, liveability, health and well-being’, Environmental Research, vol. 251, p. 118550, Jun. 2024, doi: 10.1016/j.envres.2024.118550.
[113] Y. Song, J. Preston, and D. Ogilvie, ‘New walking and cycling infrastructure and modal shift in the UK: A quasi-experimental panel study’, Transp Res Part A Policy Pract, vol. 95, pp. 320–333, Jan. 2017, doi: 10.1016/j.tra.2016.11.017.
[114] M. Jaller, C. Rodier, M. Zhang, H. Lin, and K. Lewis, ‘Fighting for Curb Space: Parking, Ride-Hailing, Urban Freight Deliveries, and Other Users’, Jun. 2021, doi: 10.7922/G22N50JJ.
[115] ‘Kerb – Grid Smarter Cities’, Kerb. Accessed: Nov. 12, 2023. [Online]. Available: https://gridsmartercities.com/kerb/
[116] ‘Coding the Curbs | Smart Zone realization’, Codingthecurbs. Accessed: Jan. 27, 2024. [Online]. Available: https://www.codingthecurbs.com/Smart-Zone-realization
[117] ‘Smart Loading Zone Pilot Project’, Urban Movement Labs. Accessed: Aug. 31, 2024. [Online]. Available: https://urbanmovementlabs.org/loadingzone/
[118] ‘Smart Loading Zones | Programs and initiatives’, City of Philadelphia. Accessed: Aug. 31, 2024. [Online]. Available: https://www.phila.gov/programs/smartcityphl/smart-loading-zones/
[119] H. Manivasakan, R. Kalra, S. O’Hern, Y. Fang, Y. Xi, and N. Zheng, ‘Infrastructure requirement for autonomous vehicle integration for future urban and suburban roads – Current practice and a case study of Melbourne, Australia’, Transportation Research Part A: Policy and Practice, vol. 152, pp. 36–53, Oct. 2021, doi: 10.1016/j.tra.2021.07.012.
[120] C. Csiszár, ‘Demand Calculation Method for Electric Vehicle Charging Station Locating and Deployment’, Periodica Polytechnica Civil Engineering, vol. 63, no. 1, Art. no. 1, Jan. 2019, doi: 10.3311/PPci.13330.
[121] L. Caggiani, R. Camporeale, B. Dimitrijević, and M. Vidović, ‘An approach to modeling bike-sharing systems based on spatial equity concept’, Transportation Research Procedia, vol. 45, pp. 185–192, Jan. 2020, doi: 10.1016/j.trpro.2020.03.006.
[122] Y. Zhang, D. Lin, and Z. Mi, ‘Electric fence planning for dockless bike-sharing services’, Journal of Cleaner Production, vol. 206, pp. 383–393, Jan. 2019, doi: 10.1016/j.jclepro.2018.09.215.
[123] R. Sandoval et al., ‘Data driven methods for effective micromobility parking’, Transportation Research Interdisciplinary Perspectives, vol. 10, p. 100368, Jun. 2021, doi: 10.1016/j.trip.2021.100368.
[124] Y. Cheng, X. Chen, X. Ding, and L. Zeng, ‘Optimizing Location of Car-Sharing Stations Based on Potential Travel Demand and Present Operation Characteristics: The Case of Chengdu’, Journal of Advanced Transportation, vol. 2019, p. e7546303, Jan. 2019, doi: 10.1155/2019/7546303.
[125] Z. Qu, X. Wang, X. Song, Z. Pan, and H. Li, ‘Location Optimization for Urban Taxi Stands Based on Taxi GPS Trajectory Big Data’, IEEE Access, vol. 7, pp. 62273–62283, 2019, doi: 10.1109/ACCESS.2019.2916342.
[126] A. Fielbaum, X. Bai, and J. Alonso-Mora, ‘On-demand ridesharing with optimized pick-up and drop-off walking locations’, Transportation Research Part C: Emerging Technologies, vol. 126, p. 103061, May 2021, doi: 10.1016/j.trc.2021.103061.
[127] G. S. Nair, C. R. Bhat, I. Batur, R. M. Pendyala, and W. H. K. Lam, ‘A model of deadheading trips and pick-up locations for ride-hailing service vehicles’, Transportation Research Part A: Policy and Practice, vol. 135, pp. 289–308, May 2020, doi: 10.1016/j.tra.2020.03.015.
[128] A. Brown, N. J. Klein, C. Thigpen, and N. Williams, ‘Impeding access: The frequency and characteristics of improper scooter, bike, and car parking’, Transportation Research Interdisciplinary Perspectives, vol. 4, p. 100099, Mar. 2020, doi: 10.1016/j.trip.2020.100099.
[129] M. Mitman et al., Dynamic Curbside Management: Keeping Pace with New and Emerging Mobility and Technology in the Public Right-of-Way, Part 1: Dynamic Curbside Management Guide and Part 2: Conduct of Research Report. Washington, D.C.: Transportation Research Board, 2022. doi: 10.17226/26718.
[130] ‘FlexCurb’, EIT Urban Mobility. Accessed: Jan. 28, 2024. [Online]. Available: https://www.eiturbanmobility.eu/projects/flexcurb/
[131] S. Smyth, ‘The future of mobility starts at the curb’, Coord. Accessed: Nov. 12, 2023. [Online]. Available: https://medium.com/coord/the-future-of-mobility-starts-at-the-curb-8b83cdb8d173
[132] ‘Curb Management Strategy’, San Francisco Municipal Transportation Agency, Feb. 2020. Accessed: Jan. 28, 2024. [Online]. Available: https://www.sfmta.com/sites/default/files/reports-and-documents/2020/02/curb_management_strategy_report.pdf
[133] ‘Flex Zone/Curb Use Priorities in Seattle – Transportation | seattle.gov’. Accessed: Jan. 27, 2024. [Online]. Available: https://www.seattle.gov/transportation/projects-and-programs/programs/parking-program/parking-regulations/flex-zone/curb-use-priorities-in-seattle
[134] S. Claris, H. Peck, and F. K. Khaku, ‘FlexKerbs – Evolving Streets for a Driverless Future’, ARUP, 2018. [Online]. Available: https://www.arup.com/-/media/arup/files/publications/f/flexkerbs_roads-for-the-future_arup.pdf
[135] Y. Liu, M. Tight, Q. Sun, and R. Kang, ‘A systematic review: Road infrastructure requirement for Connected and Autonomous Vehicles (CAVs)’, J. Phys.: Conf. Ser., vol. 1187, no. 4, p. 042073, Apr. 2019, doi: 10.1088/1742-6596/1187/4/042073.
[136] E. Nix and R. Mundy, ‘Airport Drop-Off and Pick-Up Charges in Great Britain: Will They Come to the United States?’, Nov. 2015. Accessed: Feb. 03, 2024. [Online]. Available: https://www.semanticscholar.org/paper/Airport-Drop-Off-and-Pick-Up-Charges-in-Great-Will-Nix-Mundy/15672784759a96cf5643cbb40b136061e60374c3
[137] M. Zallio, C. Chivǎran, and P. J. Clarkson, ‘Exploring Inclusion, Diversity, Equity, and Accessibility in the Built Environment: A Case Study’, Buildings, vol. 14, no. 9, Art. no. 9, Sep. 2024, doi: 10.3390/buildings14093018.
[138] D. Çelebi, A. Yörüsün, and H. Işık, ‘Bicycle sharing system design with capacity allocations’, Transportation Research Part B: Methodological, vol. 114, pp. 86–98, Aug. 2018, doi: 10.1016/j.trb.2018.05.018.
[139] R. A. Azdy and F. Darnis, ‘Use of Haversine Formula in Finding Distance Between Temporary Shelter and Waste End Processing Sites’, J. Phys.: Conf. Ser., vol. 1500, no. 1, p. 012104, Apr. 2020, doi: 10.1088/1742-6596/1500/1/012104.
[140] Ayat Al-Madadhah and Rana Imam, ‘Developing trip generation rates for restaurants in Amman’, International Journal of Information, Business and Management, vol. 12, no. 2, 2020, Accessed: Mar. 10, 2022. [Online]. Available: http://ijibm.elitehall.com/IJIBM_Vol12No2_May2020.pdf
[141] S. Basbas, K. Takatzoglou, G. Mintsis, C. Taxiltaris, and I. Politis, ‘Trip Generation Rates for a University Campus: The Case of the Aristotle University of Thessaloniki, Greece’, in Data Analytics: Paving the Way to Sustainable Urban Mobility, E. G. Nathanail and I. D. Karakikes, Eds., in Advances in Intelligent Systems and Computing. Cham: Springer International Publishing, 2019, pp. 11–18. doi: 10.1007/978-3-030-02305-8_2.
[142] COMSIS Corporation, ‘Trip Attraction Rates Study’, Arizona Department of Transportation, Phoenix, Arizona, Final Report FHWA-AZ87-233, Dec. 1987. Accessed: Mar. 10, 2022. [Online]. Available: https://apps.azdot.gov/ADOTLibrary/publications/project_reports/PDF/AZ233(1).pdf
[143] C. Klinkhardt, T. Woerle, L. Briem, M. Heilig, M. Kagerbauer, and P. Vortisch, ‘Using OpenStreetMap as a Data Source for Attractiveness in Travel Demand Models’, Transportation Research Record, vol. 2675, no. 8, pp. 294–303, Aug. 2021, doi: 10.1177/0361198121997415.
[144] S. M. Rahman and M. Mamun, Determination of Trip Attraction Rates of Shopping Centers in Dhaka City. 2014. doi: 10.13140/RG.2.1.2955.7522.
[145] M. Uddin, R. Hasan, I. Ahmed, P. Das, A. Uddin, and D. T. Hasan, ‘A Comprehensive Study on Trip Attraction Rates of Shopping Centers in Dhanmondi Area’, vol. 12, no. 04, p. 5, 2012.
[146] B. Qu, L. Mao, Z. Xu, J. Feng, and X. Wang, ‘How Many Vehicles Do We Need? Fleet Sizing for Shared Autonomous Vehicles With Ridesharing’, IEEE Transactions on Intelligent Transportation Systems, pp. 1–14, 2021, doi: 10.1109/TITS.2021.3130749.
[147] G. Valença, F. Moura, and A. Morais de Sá, ‘Main challenges and opportunities to dynamic road space allocation: From static to dynamic urban designs’, Journal of Urban Mobility, vol. 1, p. 100008, Dec. 2021, doi: 10.1016/j.urbmob.2021.100008.
[148] M. Sohaib et al., ‘Improving urban road infrastructure analysis and design using an integrated BIM-GIS and traffic microsimulation framework’, Innov. Infrastruct. Solut., vol. 9, no. 7, p. 285, Jul. 2024, doi: 10.1007/s41062-024-01609-z.
[149] S. Kanat et al., ‘Informing choices for vehicle pick-up and drop-off zones for persons with mobility disabilities–existing challenges and future needs’, d, vol. 3, no. 4, Art. no. dts-0024-0017, Sep. 2024, doi: 10.48130/dts-0024-0017.
[150] ‘Managing Curb Space in the Boston Region: A Guidebook’. Boston Region Metropolitan Planning Organization, Oct. 2021. Accessed: Feb. 09, 2025. [Online]. Available: https://www.ctps.org/data/html/studies/other/Managing-Curb-Space-in-the-Boston-Region-Guidebook/Managing-Curb-Space-in-the-Boston-Region-Guidebook.html#ch5
[151] A. H. Raudaschl, ‘The Business Model of Autonomous Tesla Taxis’, The Lean Canvas. Accessed: Aug. 24, 2021. [Online]. Available: https://medium.com/lean-canvas-takedown/the-short-term-gains-of-level-4-autonomy-on-personal-income-d51653d5310
[152] S. Tart, P. Wells, S. Beccaria, and E. Sanvicente, ‘Analysis of business models for car sharing’. Apr. 09, 2018. Accessed: May 20, 2021. [Online]. Available: http://www.lgi-consulting.com/wp-content/uploads/2019/10/STARS-D3.1.pdf
[153] H. I. Ansoff, Corporate Strategy: An Analytic Approach to Business Policy for Growth and Expansion. New York: McGraw-Hill, 1965.
[154] B. B. Abudawood, ‘Understanding corporate strategy theory through the lens of Igor Ansoff’, London School of Science & Technology. Accessed: Jul. 06, 2024. [Online]. Available: https://www.lsst.ac/blogs/ansoff/
[155] J. C. Naranjo‐Valencia, D. Jiménez‐Jiménez, and R. Sanz‐Valle, ‘Innovation or imitation? The role of organizational culture’, Management Decision, vol. 49, no. 1, pp. 55–72, Jan. 2011, doi: 10.1108/00251741111094437.
[156] S. K. Curtis, ‘Business model patterns in the sharing economy’, Sustainable Production and Consumption, vol. 27, pp. 1650–1671, Jul. 2021, doi: 10.1016/j.spc.2021.04.009.
[157] National Academies of Sciences, Engineering, and Medicine, ‘Taxis, Regulation, and the Rise of Transportation Network Companies. In: Between Public and Private Mobility: Examining the Rise of Technology-Enabled Transportation Services’, The National Academy Press, Washington, DC, TRB Special Report 319, 2016. doi: 10.17226/21875.
[158] W. Skok and S. Baker, ‘Evaluating the impact of Uber on London’s taxi service: A critical review of the literature’, Knowledge and Process Management, vol. 26, no. 1, pp. 3–9, 2019, doi: 10.1002/kpm.1573.
[159] X. Wei, G. Nan, R. Dou, and M. Li, ‘Optimal business model for the monopolistic ride-hailing platform: Pooling, premier, or hybrid?’, Knowledge-Based Systems, vol. 204, p. 106093, Sep. 2020, doi: 10.1016/j.knosys.2020.106093.
[160] H. Begum, ‘Bla Bla Car – Business Model Exemplar’, Business Model Zoo. Accessed: Aug. 30, 2021. [Online]. Available: https://www.businessmodelzoo.com/exemplars/bla-bla-car/
[161] D. Bálint and A. Trócsányi, ‘New ways of mobility: the birth of ridesharing. A case study from Hungary’, Hungarian Geographical Bulletin, vol. 65, no. 4, Art. no. 4, 2016, doi: 10.15201/hungeobull.65.4.7.
[162] P. Soltész and G. Zilahy, ‘A Network Theory Approach to the Sharing Economy’, Periodica Polytechnica Social and Management Sciences, vol. 28, no. 1, Art. no. 1, 2020, doi: 10.3311/PPso.12597.
[163] ‘Avis Budget business model canvas’, Vizologi | rethinking business model design. Accessed: Aug. 13, 2021. [Online]. Available: http://vizologi.com/business-strategy-canvas/avis-budget-business-model-canvas/
[164] ‘Drivy business model canvas’, Vizologi | rethinking business model design. Accessed: Sep. 02, 2021. [Online]. Available: http://vizologi.com/business-strategy-canvas/drivy-business-model-canvas/
[165] ‘Turo business model canvas’, Vizologi | rethinking business model design. Accessed: Sep. 02, 2021. [Online]. Available: http://vizologi.com/business-strategy-canvas/turo-business-model-canvas/
[166] B. Cohen and J. Kietzmann, ‘Ride On! Mobility Business Models for the Sharing Economy’, Organization & Environment, vol. 27, no. 3, pp. 279–296, Sep. 2014, doi: 10.1177/1086026614546199.
[167] A. Maurya, ‘Chapter 3: Create your Lean Canvas’, in Running Lean: Iterate from Plan A to a Plan That Works, Sebastopol, CA: O’Reilly Media, Inc., 2012, pp. 23–48.
[168] M. Geissdoerfer, D. Vladimirova, and S. Evans, ‘Sustainable business model innovation: A review’, Journal of Cleaner Production, vol. 198, pp. 401–416, Oct. 2018, doi: 10.1016/j.jclepro.2018.06.240.
[169] A. Joyce and R. L. Paquin, ‘The triple layered business model canvas: A tool to design more sustainable business models’, Journal of Cleaner Production, vol. 135, pp. 1474–1486, Nov. 2016, doi: 10.1016/j.jclepro.2016.06.067.
[170] K. Münzel, W. Boon, K. Frenken, and T. Vaskelainen, ‘Carsharing business models in Germany: characteristics, success and future prospects’, Inf Syst E-Bus Manage, vol. 16, no. 2, pp. 271–291, May 2018, doi: 10.1007/s10257-017-0355-x.
[171] M. Harb, A. Stathopoulos, Y. Shiftan, and J. L. Walker, ‘What do we (Not) know about our future with automated vehicles?’, Transportation Research Part C: Emerging Technologies, vol. 123, p. 102948, Feb. 2021, doi: 10.1016/j.trc.2020.102948.
[172] L. L. J. Meijer, F. Schipper, and J. C. C. M. Huijben, ‘Align, adapt or amplify: Upscaling strategies for car sharing business models in Sydney, Australia’, Environmental Innovation and Societal Transitions, vol. 33, pp. 215–230, Nov. 2019, doi: 10.1016/j.eist.2019.06.003.
[173] H. Guyader and L. Piscicelli, ‘Business model diversification in the sharing economy: The case of GoMore’, Journal of Cleaner Production, vol. 215, pp. 1059–1069, Apr. 2019, doi: 10.1016/j.jclepro.2019.01.114.
[174] F. Damanpour and D. Aravind, ‘Chapter 19 – Organizational Structure and Innovation Revisited: From Organic To Ambidextrous Structure’, in Handbook of Organizational Creativity, M. D. Mumford, Ed., San Diego: Academic Press, 2012, pp. 483–513. doi: 10.1016/B978-0-12-374714-3.00019-7.
[175] K. Stoiber, K. Matzler, and J. Hautz, ‘Ambidextrous structures paving the way for disruptive business models: a conceptual framework’, Rev Manag Sci, vol. 17, no. 4, pp. 1439–1485, May 2023, doi: 10.1007/s11846-022-00589-7.
[176] J. Morgan, ‘The 5 Types Of Organizational Structures: Part 4, Flatarchies’. Accessed: Jul. 02, 2021. [Online]. Available: https://www.forbes.com/sites/jacobmorgan/2015/07/15/the-5-types-of-organizational-structures-part-4-flatarchies/?sh=275d587c6707
[177] K. Cameron and R. Quinn, Diagnosing and Changing Organizational Culture: Based on the Competing Values Framework. 1999. Accessed: May 18, 2024. [Online]. Available: https://www.semanticscholar.org/paper/Diagnosing-and-Changing-Organizational-Culture%3A-on-Cameron-Quinn/4123a70abb4ae0e357613930d8f1feb82ea7194e
[178] H. Liu, W. Ke, K. K. Wei, J. Gu, and H. Chen, ‘The role of institutional pressures and organizational culture in the firm’s intention to adopt internet-enabled supply chain management systems’, Journal of Operations Management, vol. 28, no. 5, pp. 372–384, 2010, doi: 10.1016/j.jom.2009.11.010.
[179] Z. Chen, S. Huang, C. Liu, M. Min, and L. Zhou, ‘Fit between Organizational Culture and Innovation Strategy: Implications for Innovation Performance’, Sustainability, vol. 10, no. 10, Art. no. 10, Oct. 2018, doi: 10.3390/su10103378.
[180] J. Birkinshaw and J. Ridderstrale, ‘Adhocracy for an agile age’, McKinsey. Accessed: Jul. 01, 2021. [Online]. Available: https://www.mckinsey.com/business-functions/organization/our-insights/adhocracy-for-an-agile-age
[181] R. M. Burton, J. Lauridsen, and B. Obel, ‘The impact of organizational climate and strategic fit on firm performance’, Human Resource Management, vol. 43, no. 1, pp. 67–82, 2004, doi: 10.1002/hrm.20003.
[182] F. Andam, ‘Knowledge Sharing: Exploring the Links to Organizational Culture’, International Journal of Health Economics and Policy, vol. 2, no. 1, Art. no. 1, Jan. 2017, doi: 10.11648/j.hep.20170201.14.
[183] D. Silva, D. Földes, and C. Csiszár, ‘Business Model for Shared Autonomous Vehicles Mobility Services’, Tehnički vjesnik, vol. 31, no. 2, pp. 647–656, Feb. 2024, doi: 10.17559/TV-20230502000597.
[184] N. Krizsik and T. Sipos, ‘Social Perception of Autonomous Vehicles’, Periodica Polytechnica Transportation Engineering, vol. 51, no. 2, Art. no. 2, Feb. 2023, doi: 10.3311/PPtr.20228.
[185] K. Harel, ‘Self-driving cars must be able to communicate with each other’, AARHUS University, Department of Electrical and Computer Engineering. Accessed: Jan. 05, 2023. [Online]. Available: https://ece.au.dk/en/currently/news/show/artikel/self-driving-cars-must-be-able-to-communicate-with-each-other
[186] ‘Vehicle-to-Vehicle Communication | NHTSA’. Accessed: Jan. 05, 2023. [Online]. Available: https://www.nhtsa.gov/technology-innovation/vehicle-vehicle-communication
[187] M. A. Richter, J. Hess, C. Baur, and R. Stern, ‘Exploring the Financial Implications of Operating a Shared Autonomous Electric Vehicle Fleet in Zurich’, Journal of Urban Mobility, vol. 1, p. 100001, Dec. 2021, doi: 10.1016/j.urbmob.2021.100001.
[188] J. Farhan and T. D. Chen, ‘Impact of ridesharing on operational efficiency of shared autonomous electric vehicle fleet’, Transportation Research Part C: Emerging Technologies, vol. 93, pp. 310–321, Aug. 2018, doi: 10.1016/j.trc.2018.04.022.
[189] Kecskés E. and Lukovics M., ‘Az önvezetőjármű-használat techno-ökonómiai megközelítése’, Polgári szemle, vol. 19, no. 1–3, pp. 181–196, 2023, doi: 10.24307/psz.2023.0912.
[190] G. F. Watson, S. Worm, R. W. Palmatier, and S. Ganesan, ‘The Evolution of Marketing Channels: Trends and Research Directions’, Journal of Retailing, vol. 91, no. 4, pp. 546–568, Dec. 2015, doi: 10.1016/j.jretai.2015.04.002.
[191] A. Nikitas, A.-E. Vitel, and C. Cotet, ‘Autonomous vehicles and employment: An urban futures revolution or catastrophe?’, Cities, vol. 114, p. 103203, Jul. 2021, doi: 10.1016/j.cities.2021.103203.
[192] M. Kamargianni and M. Matyas, ‘The Business Ecosystem of Mobility-as-a-Service’, presented at the 96th Transportation Research Board (TRB) Annual Meeting, Washington, DC, Jan. 2017, p. 14.
[193] R. Hoogendoorn, B. van Arerm, and S. Hoogendoom, ‘Automated Driving, Traffic Flow Efficiency, and Human Factors: Literature Review’, Transportation Research Record, vol. 2422, no. 1, pp. 113–120, Jan. 2014, doi: 10.3141/2422-13.
[194] K. Emory, F. Douma, and J. Cao, ‘Autonomous vehicle policies with equity implications: Patterns and gaps’, Transportation Research Interdisciplinary Perspectives, vol. 13, p. 100521, Mar. 2022, doi: 10.1016/j.trip.2021.100521.
[195] S. Sohrabi, H. Khreis, and D. Lord, ‘Impacts of Autonomous Vehicles on Public Health: A Conceptual Model and Policy Recommendations’, Sustainable Cities and Society, vol. 63, p. 102457, Dec. 2020, doi: 10.1016/j.scs.2020.102457.
[196] M. Chester, A. Horvath, and S. Madanat, ‘Parking infrastructure: energy, emissions, and automobile life-cycle environmental accounting’, Environ. Res. Lett., vol. 5, no. 3, p. 034001, Jul. 2010, doi: 10.1088/1748-9326/5/3/034001.
[197] Ó. Silva, R. Cordera, E. González-González, and S. Nogués, ‘Environmental impacts of autonomous vehicles: A review of the scientific literature’, Science of The Total Environment, vol. 830, p. 154615, Jul. 2022, doi: 10.1016/j.scitotenv.2022.154615.
[198] K. Othman, ‘Exploring the implications of autonomous vehicles: a comprehensive review’, Innov. Infrastruct. Solut., vol. 7, no. 2, p. 165, Mar. 2022, doi: 10.1007/s41062-022-00763-6.
[199] H. Yan, K. M. Kockelman, and K. M. Gurumurthy, ‘Shared autonomous vehicle fleet performance: Impacts of trip densities and parking limitations’, Transportation Research Part D: Transport and Environment, vol. 89, p. 102577, Dec. 2020, doi: 10.1016/j.trd.2020.102577.
[200] A. Dianin, E. Ravazzoli, and G. Hauger, ‘Implications of Autonomous Vehicles for Accessibility and Transport Equity: A Framework Based on Literature’, Sustainability, vol. 13, no. 8, Art. no. 8, Jan. 2021, doi: 10.3390/su13084448.
[201] A. M. Sariol and M. A. Abebe, ‘The influence of CEO power on explorative and exploitative organizational innovation’, Journal of Business Research, vol. 73, pp. 38–45, Apr. 2017, doi: 10.1016/j.jbusres.2016.11.016.
[202] D. Patel, ‘The Pros And Cons Of Outsourcing’, Forbes. Accessed: Jun. 15, 2024. [Online]. Available: https://www.forbes.com/sites/deeppatel/2017/07/17/the-pros-and-cons-of-outsourcing-and-the-effect-on-company-culture/
[203] A. Ogorelc, ‘Outsourcing of Transport and Logistics Services’, Promet – Traffic&Transportation, vol. 19, no. 6, Art. no. 6, 2007.
[204] C. Sanchis-Pedregosa, J. A. D. Machuca, and M.-M. González-Zamora, ‘Determinants of success in transport services outsourcing: empirical study in Europe’, The International Journal of Logistics Management, vol. 29, no. 1, pp. 261–283, Jan. 2018, doi: 10.1108/IJLM-09-2016-0207.
[205] C. S. Muzammel, M. Spichkova, and J. Harland, ‘Cultural Influence on Autonomous Vehicles Acceptance’, in Mobile and Ubiquitous Systems: Computing, Networking and Services, A. Zaslavsky, Z. Ning, V. Kalogeraki, D. Georgakopoulos, and P. K. Chrysanthis, Eds., Cham: Springer Nature Switzerland, 2024, pp. 538–547. doi: 10.1007/978-3-031-63992-0_37.
[206] K. Othman, ‘Public acceptance and perception of autonomous vehicles: a comprehensive review’, AI Ethics, vol. 1, no. 3, pp. 355–387, Aug. 2021, doi: 10.1007/s43681-021-00041-8.
[207] J. M. M. Post, A. Berfu Ünal, J. L. Veldstra, D. de Waard, and L. Steg, ‘Acceptability of connected automated vehicles: Attributes, perceived behavioural control, and perceived adoption norm’, Transportation Research Part F: Traffic Psychology and Behaviour, vol. 102, pp. 411–423, Apr. 2024, doi: 10.1016/j.trf.2024.03.012.
[208] X. Sun et al., ‘Exploring Personalised Autonomous Vehicles to Influence User Trust’, Cogn Comput, vol. 12, no. 6, pp. 1170–1186, Nov. 2020, doi: 10.1007/s12559-020-09757-x.
[209] ERTICO – ITS Europe, ‘Mobility as a Service (MaaS) and Sustainable Urban Mobility Planning’, Sep. 2019. Accessed: Apr. 04, 2022. [Online]. Available: https://www.eltis.org/sites/default/files/mobility_as_a_service_maas_and_sustainable_urban_mobility_planning.pdf
[210] A. Polydoropoulou, I. Pagoni, A. Tsirimpa, A. Roumboutsos, M. Kamargianni, and I. Tsouros, ‘Prototype business models for Mobility-as-a-Service’, Transportation Research Part A: Policy and Practice, vol. 131, pp. 149–162, Jan. 2020, doi: 10.1016/j.tra.2019.09.035.
[211] M. Le Pira, L. A. Tavasszy, G. H. de A. Correia, M. Ignaccolo, and G. Inturri, ‘Opportunities for integration between Mobility as a Service (MaaS) and freight transport: A conceptual model’, Sustainable Cities and Society, vol. 74, p. 103212, Nov. 2021, doi: 10.1016/j.scs.2021.103212.
[212] N. Carbonara, A. Messeni Petruzzelli, U. Panniello, and D. De Vita, ‘Embracing new disruptions: Business model innovation in the transition to Mobility as a Service (MaaS)’, Journal of Cleaner Production, vol. 464, p. 142744, Jul. 2024, doi: 10.1016/j.jclepro.2024.142744.
[213] Dahlen Silva, Dávid Földes, and Csaba Csiszár, ‘Business Model for Mobility Services Based on Shared Autonomous Vehicles’, in 19th European Transport Congress – European Green Deal Challenges And Solutions For Mobility and Logistics In Cities, Maribor, Slovenia, Oct. 2021, pp. 159–172. Accessed: Jan. 25, 2022. [Online]. Available: https://www.fgpa.um.si/wp-content/uploads/2023/10/Conference-Proceedings_compressed.pdf
[214] P. M. Bösch, F. Becker, H. Becker, and K. W. Axhausen, ‘Cost-based analysis of autonomous mobility services’, Transport Policy, vol. 64, pp. 76–91, May 2018, doi: 10.1016/j.tranpol.2017.09.005.
[215] F. J. Bahamonde-Birke, M. Goletz, and D. Ettema, ‘The provision of mobility as a service with autonomous vehicles. The necessity of regulatory schemes for a natural monopoly’, Research in Transportation Economics, vol. 90, p. 100993, Dec. 2021, doi: 10.1016/j.retrec.2020.100993.
[216] V. Kumar, ‘Making “Freemium” Work’, Harvard Business Review, May 01, 2014. Accessed: Apr. 04, 2022. [Online]. Available: https://hbr.org/2014/05/making-freemium-work
[217] K. Othman, ‘Public attitude towards autonomous vehicles before and after crashes: A detailed analysis based on the demographic characteristics’, Cogent Engineering, vol. 10, no. 1, p. 2156063, Dec. 2023, doi: 10.1080/23311916.2022.2156063.
[218] D. Paddeu, I. Tsouros, G. Parkhurst, A. Polydoropoulou, and I. Shergold, ‘A study of users’ preferences after a brief exposure in a Shared Autonomous Vehicle (SAV)’, Transportation Research Procedia, vol. 52, pp. 533–540, Jan. 2021, doi: 10.1016/j.trpro.2021.01.063.
[219] J. Ye, D. Wang, X. Li, K. W. Axhausen, and Y. Jin, ‘Assessing one-way carsharing’s impacts on vehicle ownership: Evidence from Shanghai with an international comparison’, Transportation Research Part A: Policy and Practice, vol. 150, pp. 16–32, Aug. 2021, doi: 10.1016/j.tra.2021.05.012.
[220] E. Martin, S. A. Shaheen, and J. Lidicker, ‘Impact of Carsharing on Household Vehicle Holdings: Results from North American Shared-Use Vehicle Survey’, Transportation Research Record, vol. 2143, no. 1, pp. 150–158, Jan. 2010, doi: 10.3141/2143-19.
[221] S. Tabares, V. Parida, and I. Visnjic, ‘Revenue models for digital services in the railway industry: A framework for choosing the right revenue model’, Journal of Business Research, vol. 165, p. 114041, Oct. 2023, doi: 10.1016/j.jbusres.2023.114041.
[222] A. Lambrecht et al., ‘How do firms make money selling digital goods online?’, Mark Lett, vol. 25, no. 3, pp. 331–341, Sep. 2014, doi: 10.1007/s11002-014-9310-5.
[223] Rahul, ‘How Uber works and makes Money: Business and revenue model of Uber -’. Accessed: Mar. 21, 2022. [Online]. Available: https://www.appsrhino.com/how-uber-works-and-makes-money-business-and-revenue-model-of-uber/
[224] G. Cuofano, ‘How Does Uber Make Money? Uber Business Model In A Nutshell’, FourWeekMBA. Accessed: Mar. 21, 2022. [Online]. Available: https://fourweekmba.com/uber-business-model/
[225] C. Atiyeh, ‘Car Subscription Services: The Complete Guide To Getting The Car You Want’, Forbes Wheels. Accessed: Mar. 21, 2022. [Online]. Available: https://www.forbes.com/wheels/advice/car-subscription-services/
[226] A. Bechmann, K. Bilgrav-Nielsen, and A.-L. Korsgaard Jensen, ‘Data as a Revenue Model : Sharewall as a Payment Method and Editorial Algorithm in the News Industry’, Nordicom Information, vol. 38, no. 1, pp. 76–82, 2016.
[227] D. G. Seiberth, ‘Data-driven Business Models in Connected Cars, Mobility Services & Beyond’, p. 58.
[228] L. Block and F. Herrmann, ‘Estimating Advertisement Revenue for Robocabs’, Transportation Research Procedia, vol. 41, pp. 511–524, Jan. 2019, doi: 10.1016/j.trpro.2019.09.084.
[229] G. Cuofano, ‘The Advertising Economy: Inside Facebook Money-Making Machine’, FourWeekMBA. Accessed: Mar. 21, 2022. [Online]. Available: http://fourweekmba.com/facebook-advertising-business/
[230] C. Mulley and J. Nelson, ‘How Mobility as a Service Impacts Public Transport Business Models’, vol. 2020/17. in International Transport Forum Discussion Papers, vol. 2020/17. International Transport Forum, Oct. 12, 2020. doi: 10.1787/df75f80e-en.
[231] M. Kuusisto, ‘Consumer preferences in adopting product-service systems with a subscription revenue model’, Master, Aalto University, 2018. Accessed: Jan. 28, 2022. [Online]. Available: https://aaltodoc.aalto.fi:443/handle/123456789/36479
[232] D. J. Fagnant and K. M. Kockelman, ‘Dynamic ride-sharing and fleet sizing for a system of shared autonomous vehicles in Austin, Texas’, Transportation, vol. 45, no. 1, pp. 143–158, Jan. 2018, doi: 10.1007/s11116-016-9729-z.
[233] J. Sochor, H. Arby, I. C. M. Karlsson, and S. Sarasini, ‘A topological approach to Mobility as a Service: A proposed tool for understanding requirements and effects, and for aiding the integration of societal goals’, Research in Transportation Business & Management, vol. 27, pp. 3–14, Jun. 2018, doi: 10.1016/j.rtbm.2018.12.003.
[234] Daniel Hörcher and Daniel Graham, ‘Pricing and Efficient Public Transport Supply in a Mobility as a Service Context’, International Transport Forum Discussion Papers 2020/15, Oct. 2020. doi: 10.1787/79126b85-en.
[235] P.-J. Kao, C. Busquet, V. Lubello, M. Meta, and C. van den Heuvel, ‘Review of BMs for new mobility services’, GECKO 1.2, Dec. 2019. Accessed: Aug. 24, 2021. [Online]. Available: http://h2020-gecko.eu/fileadmin/user_upload/publications/GECKO_D1.2_Review_of_business_models_for_new_mobility_services.pdf
[236] S. Nagy and C. Csiszár, ‘Assessment Methods for Comparing Shared Mobility and Conventional Transportation Modes in Urban Areas’, Periodica Polytechnica Social and Management Sciences, vol. 30, no. 2, Art. no. 2, Jun. 2022, doi: 10.3311/PPso.16605.
[237] L. Piovesan, J. Moody, and A. Waksburg Guerrini, ‘Mobility-as-a-Service: Governing innovation and multimodality in urban transport.’, The World Bank, Jan. 2024. Accessed: Feb. 15, 2025. [Online]. Available: https://thedocs.worldbank.org/en/doc/9cb81b76c8a83cd502c346146dce26bd-0090062024/original/Mobility-as-a-Services-NewTrends.pdf?utm_source=chatgpt.com
[238] K. L. Fleming, ‘Social Equity Considerations in the New Age of Transportation: Electric, Automated, and Shared Mobility’, vol. 13, no. 1, 2018.
[239] A. Kustar, A. Davidson, T. H. Tun, B. Welle, and S. Muralidaran, ‘A Fare Look: Funding Urban Public Transport Operations’, Nov. 2024, Accessed: Feb. 15, 2025. [Online]. Available: https://www.wri.org/research/fare-look-funding-urban-public-transport-operations
[240] B. Mo, Z. Cao, H. Zhang, Y. Shen, and J. Zhao, ‘Competition between shared autonomous vehicles and public transit: A case study in Singapore’, Transportation Research Part C: Emerging Technologies, vol. 127, p. 103058, Jun. 2021, doi: 10.1016/j.trc.2021.103058.
[241] Norway’s evolving incentives for zero-emission vehicles. 2022. Accessed: Feb. 15, 2025. [Online]. Available: https://www.oecd.org/en/publications/ipac-policies-in-practice_22632907-en/norway-s-evolving-incentives-for-zero-emission-vehicles_22d2485b-en.html
[242] N. Quarles, K. M. Kockelman, and J. Lee, ‘Americans’ Plans for Acquiring and Using Electric, Shared, and Self-Driving Cars’, in Electrifying Mobility: Realising a Sustainable Future for the Car, vol. 15, G. Parkhurst and W. Clayton, Eds., in Transport and Sustainability, vol. 15. , Emerald Publishing Limited, 2022, pp. 211–230. doi: 10.1108/S2044-994120220000015013.